Rotterdam, Netherlands
It is April 27, 2018 and we are at the port in Rotterdam, Netherlands. It is a city in the South Holland part of the Netherlands, within the Rhine Meuse Scheldt river delta at the North Sea. Its history goes back to 1270. Rotterdam is Europe's largest port, and has a population of 633,471 (2017), the second-largest in the Netherlands, just behind Amsterdam.
Overall the demographics differ per city area. According to a recent area analysis, the city center has a singles population of 70%, between the ages of 20 and 40, considerably more than other city areas. Also the city center has a much larger population of people with higher education and higher income. Nonetheless, 80% of the homes are rented, not owned. The city center also has a higher percentage (51% vs 45%) of foreign-born citizens. The majority (70%) of shops are also run by foreign-born citizens.
Things We Did
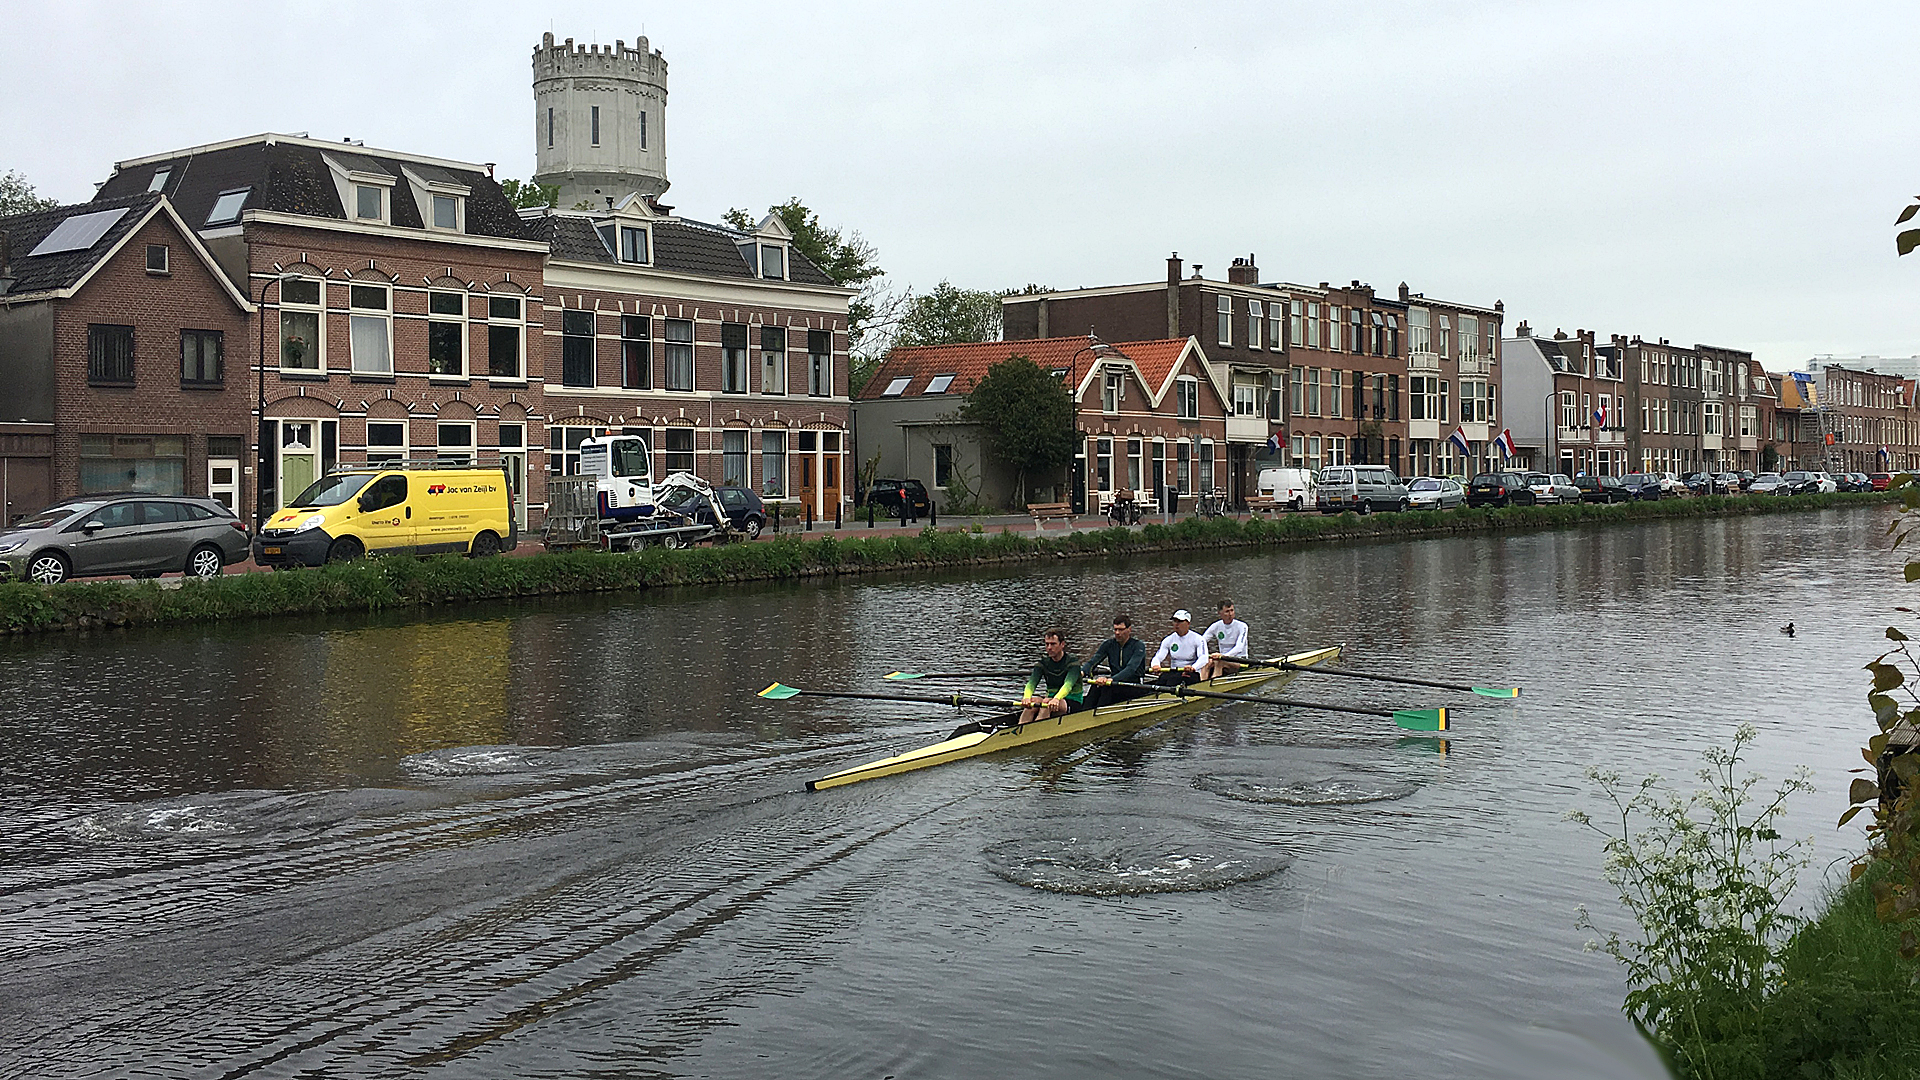
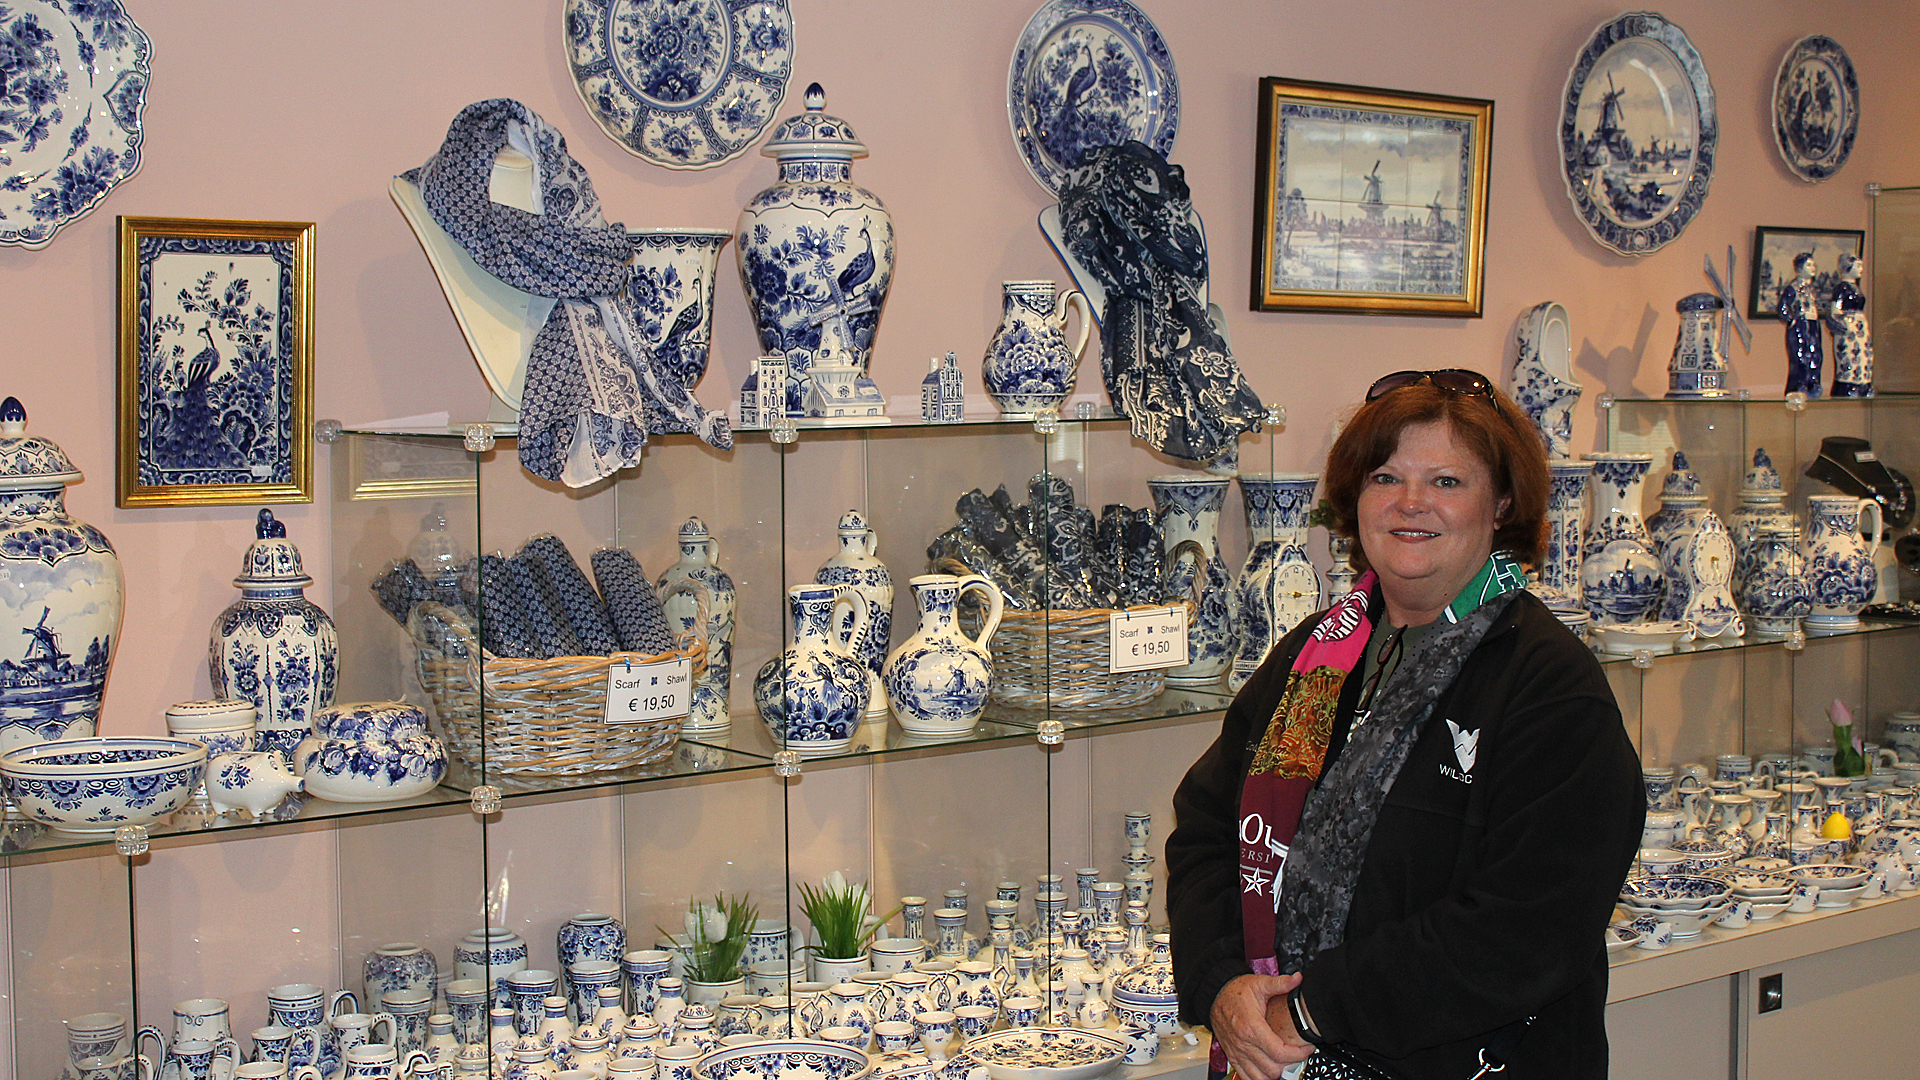
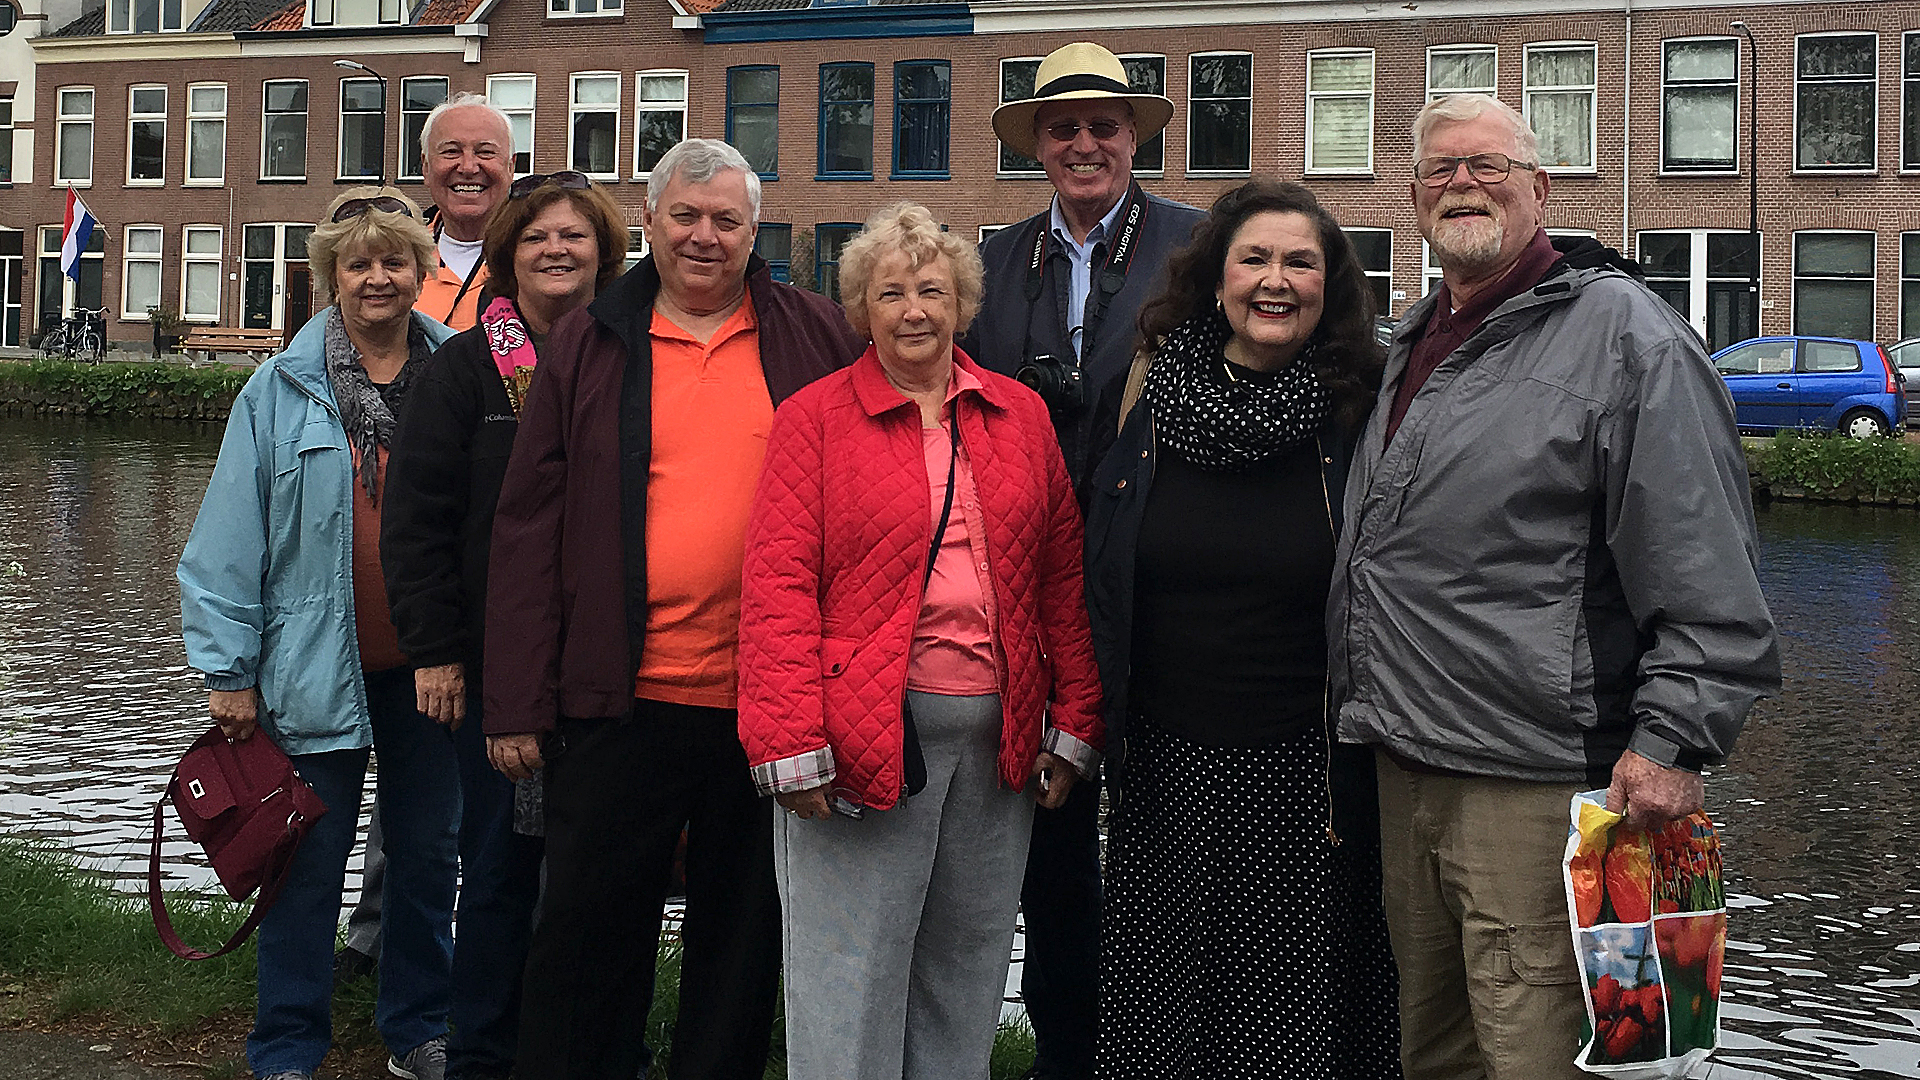 Eight of us paid for a private tour. First stop was the town of Delft where we went to the pottery facility. The city of Delft has several canals and the factory was across the street from one that was fairly wide. It had narrow roads running down both side of the canal. A rowing team was practicing when we arrived.
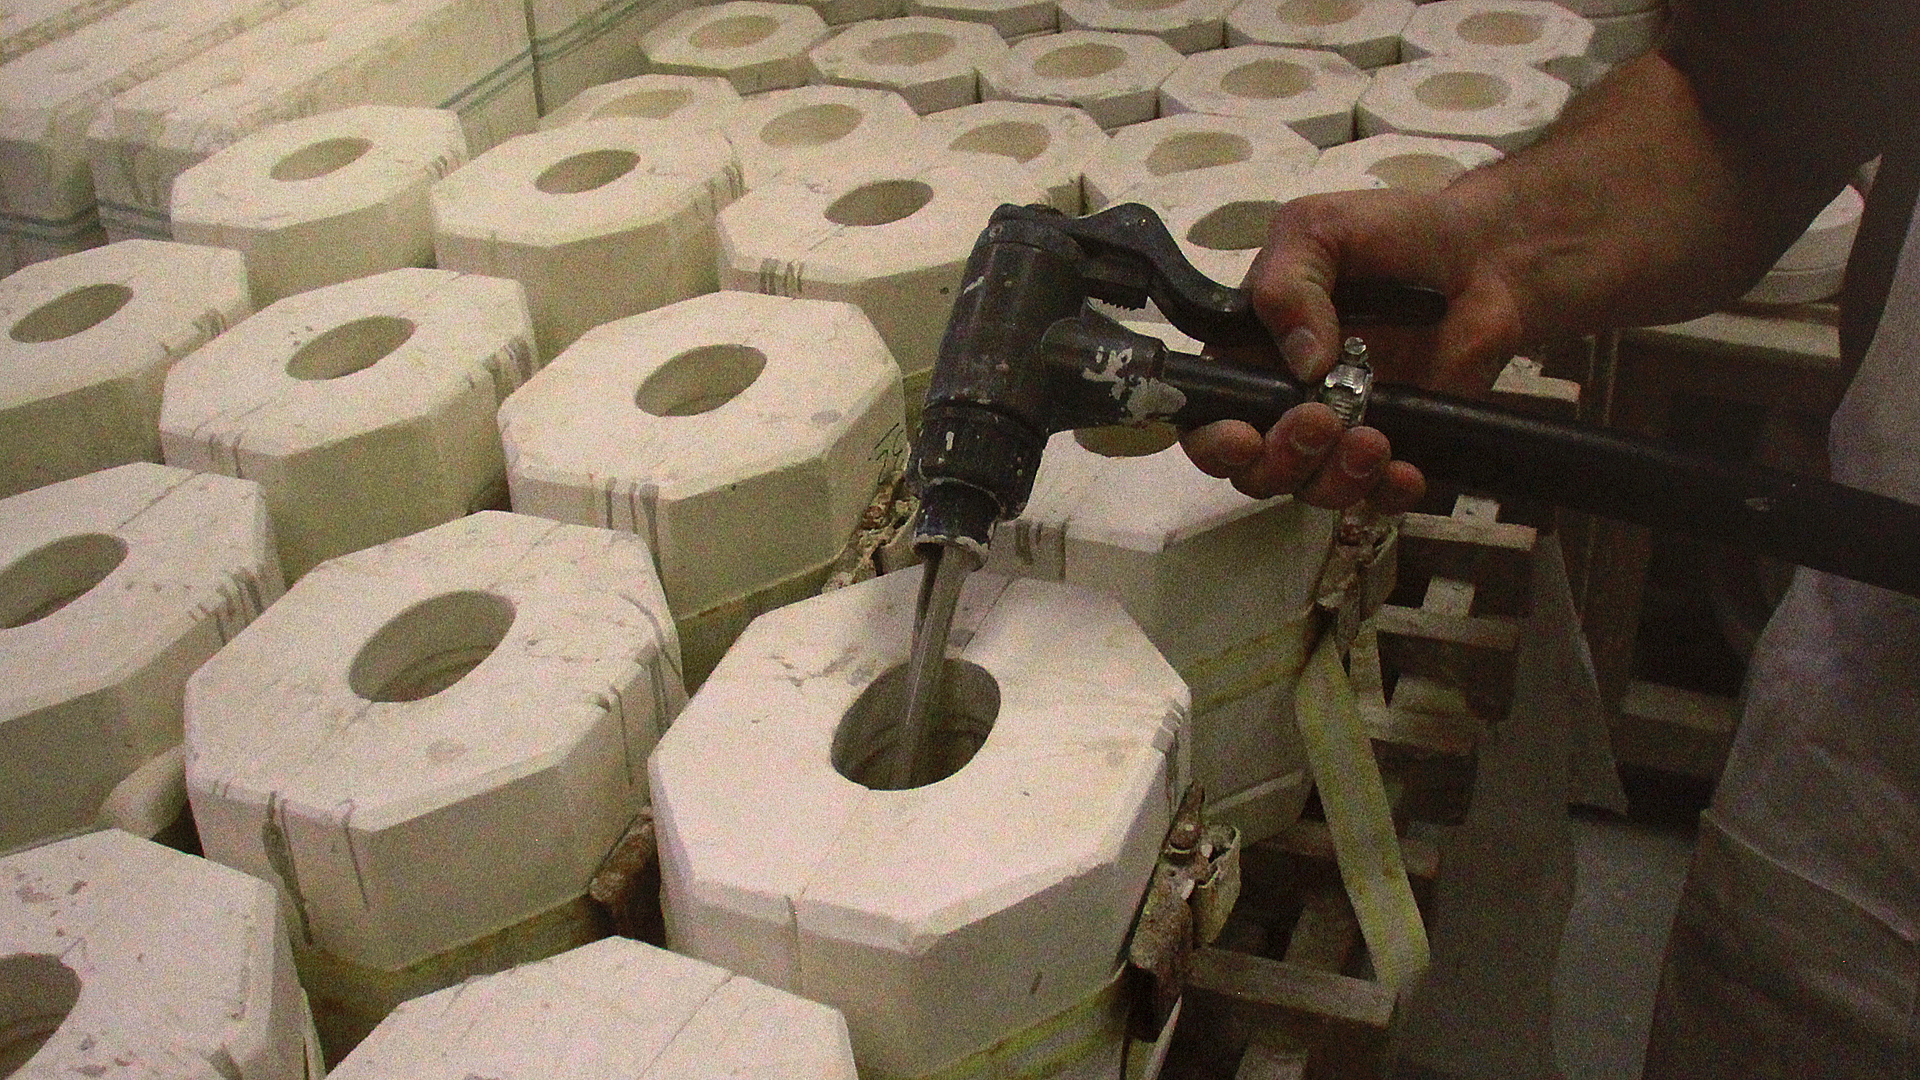
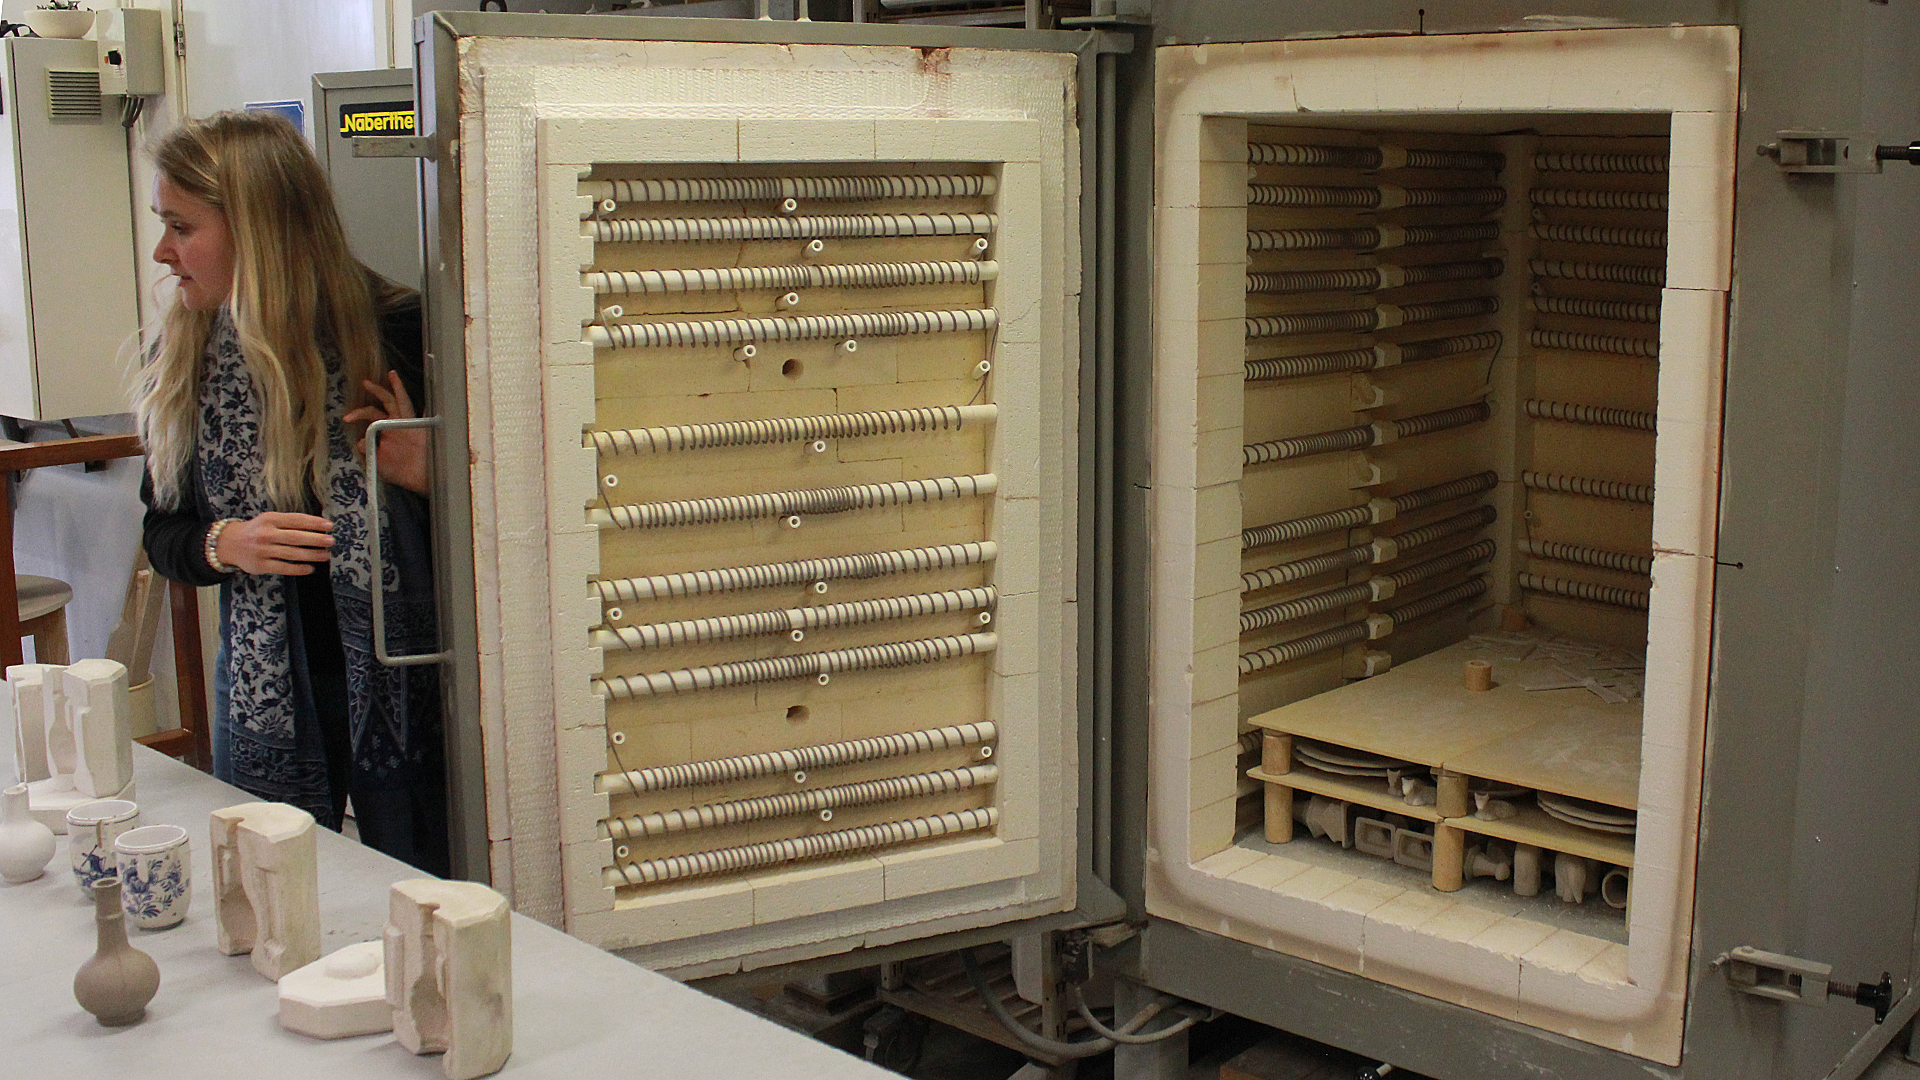
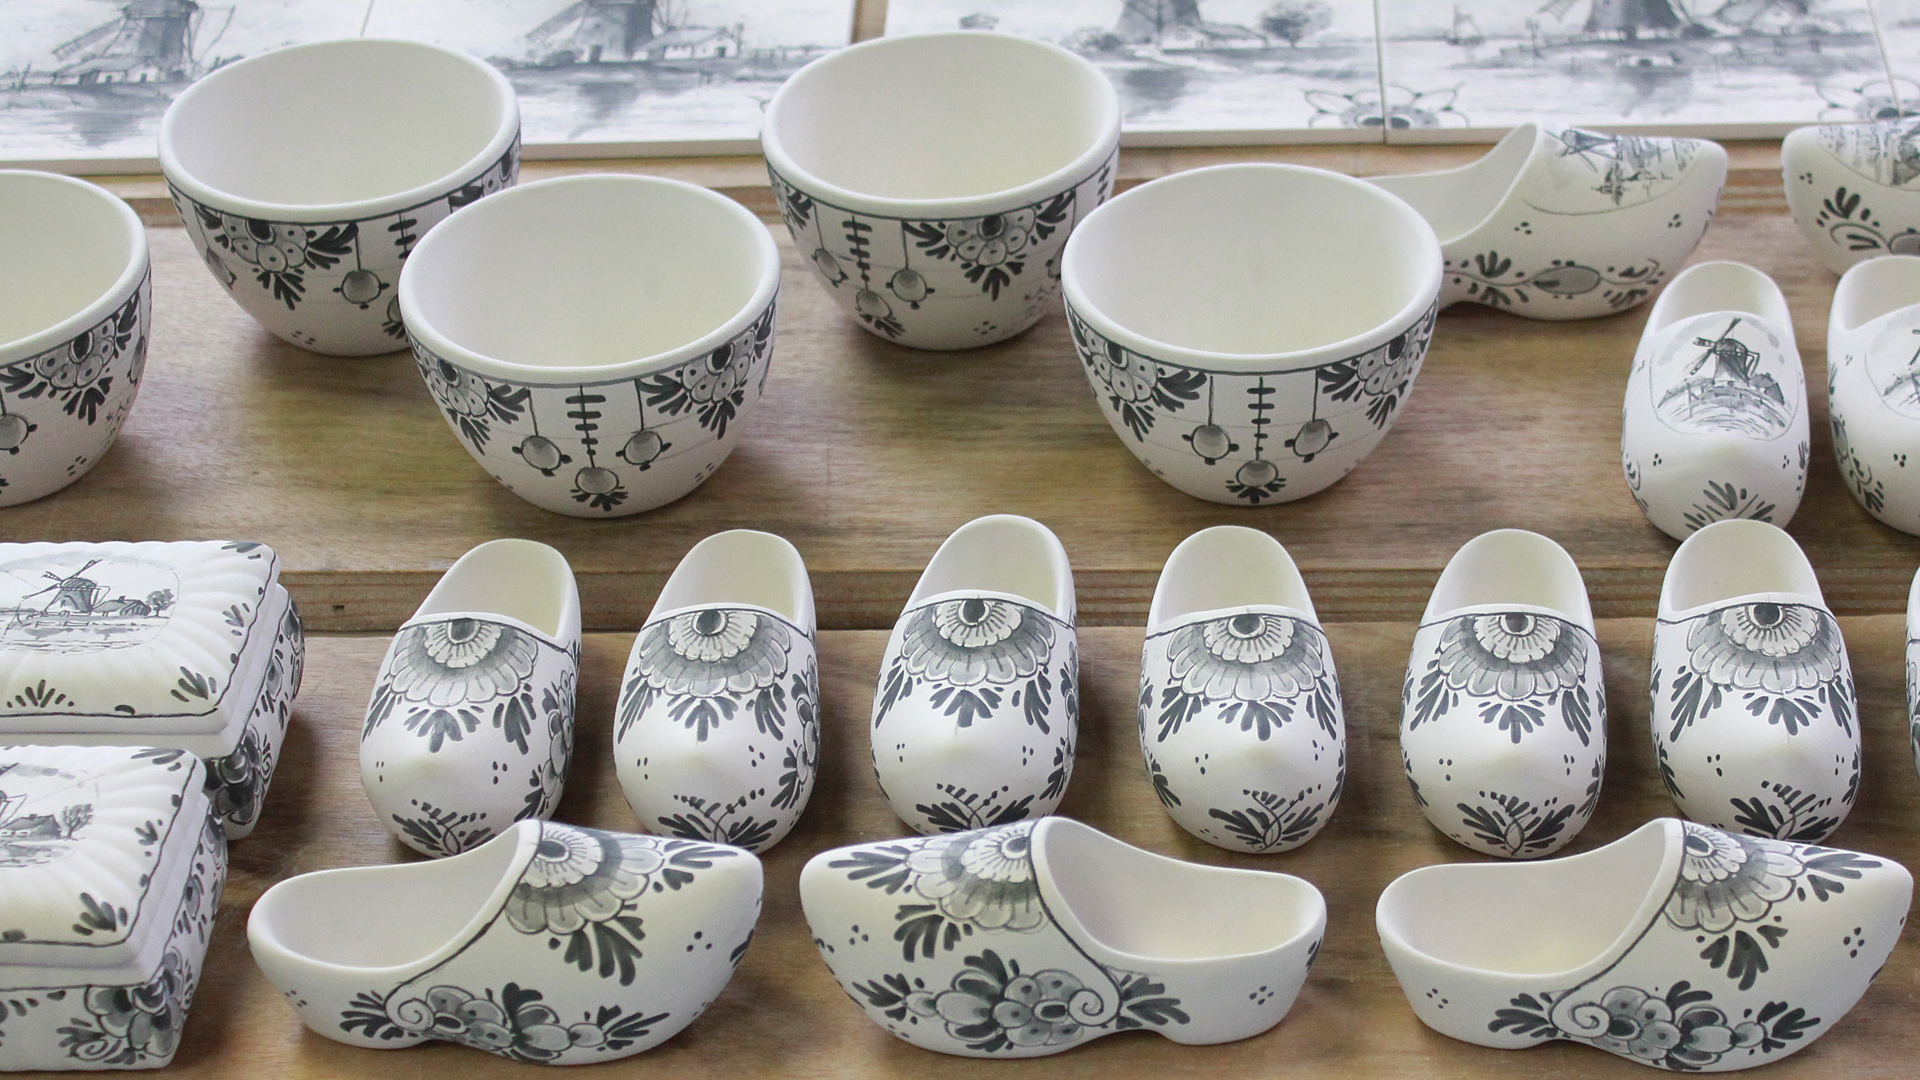
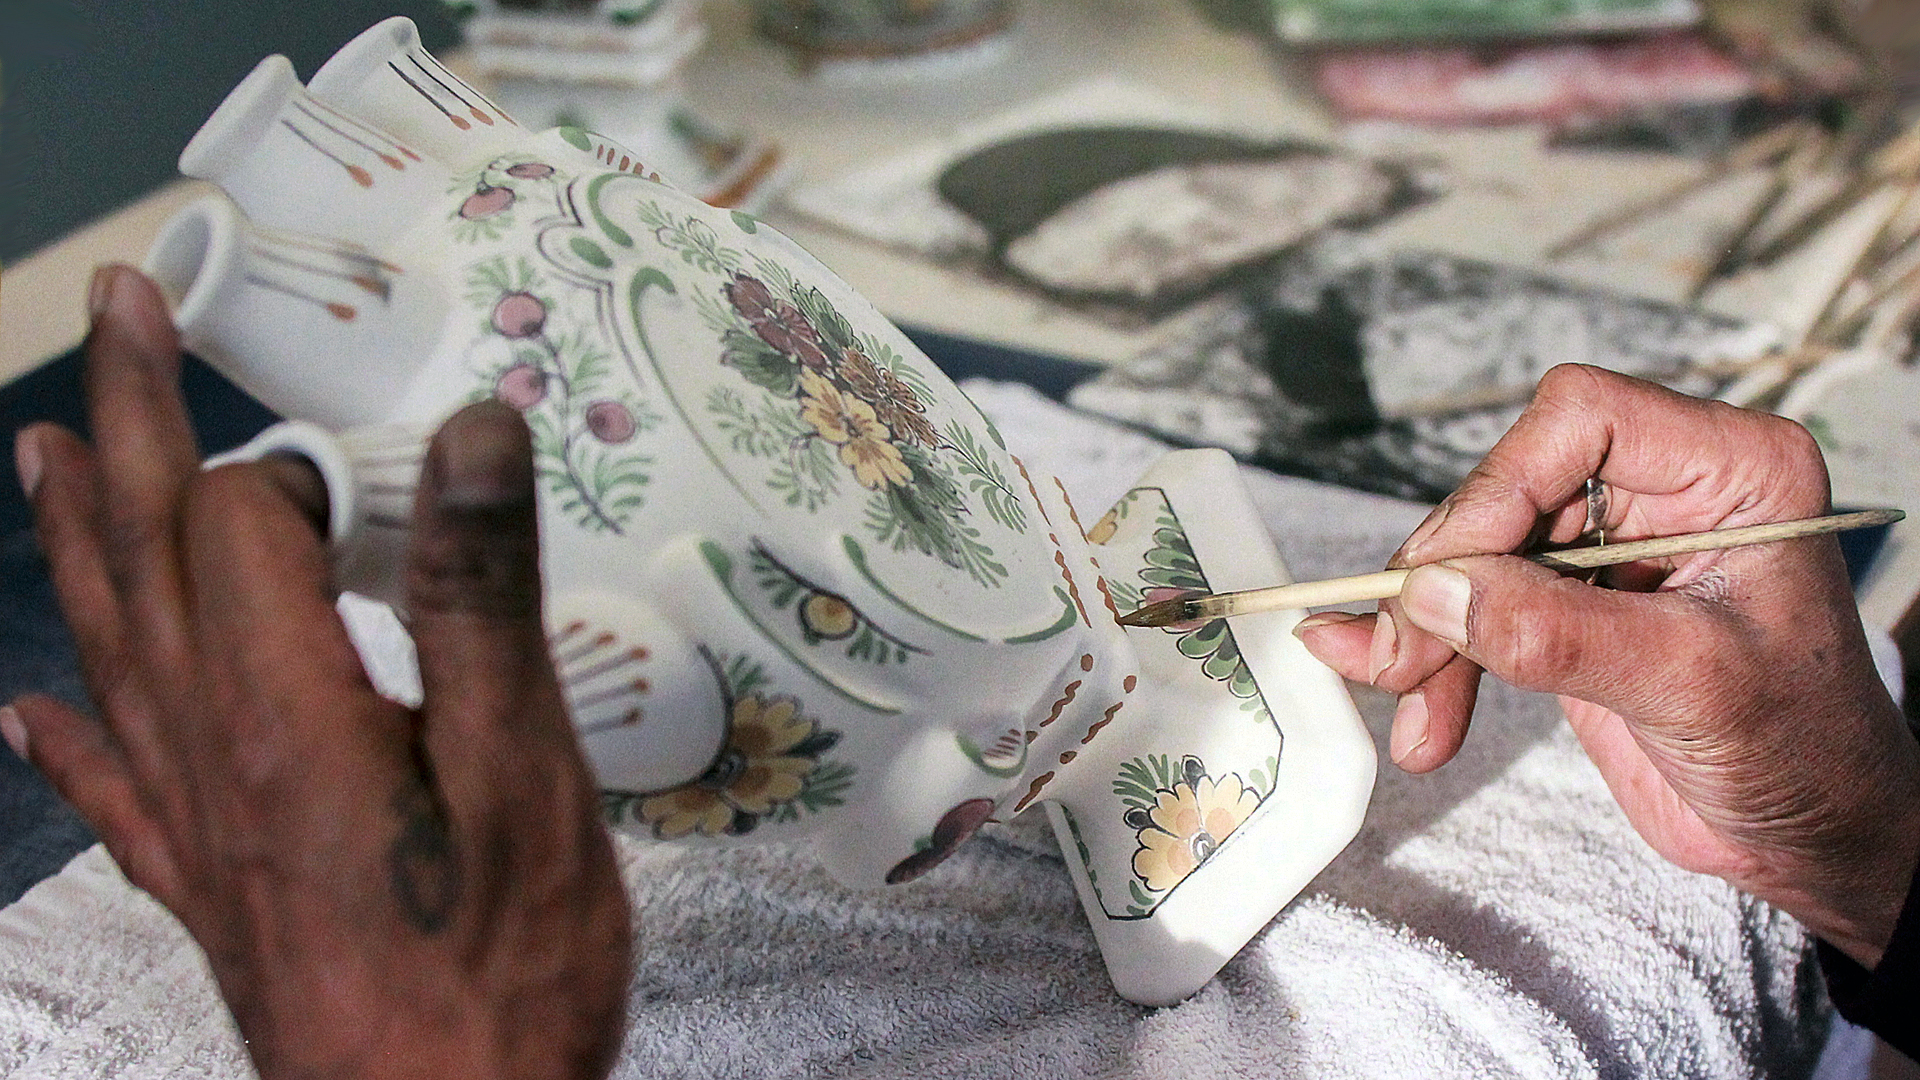
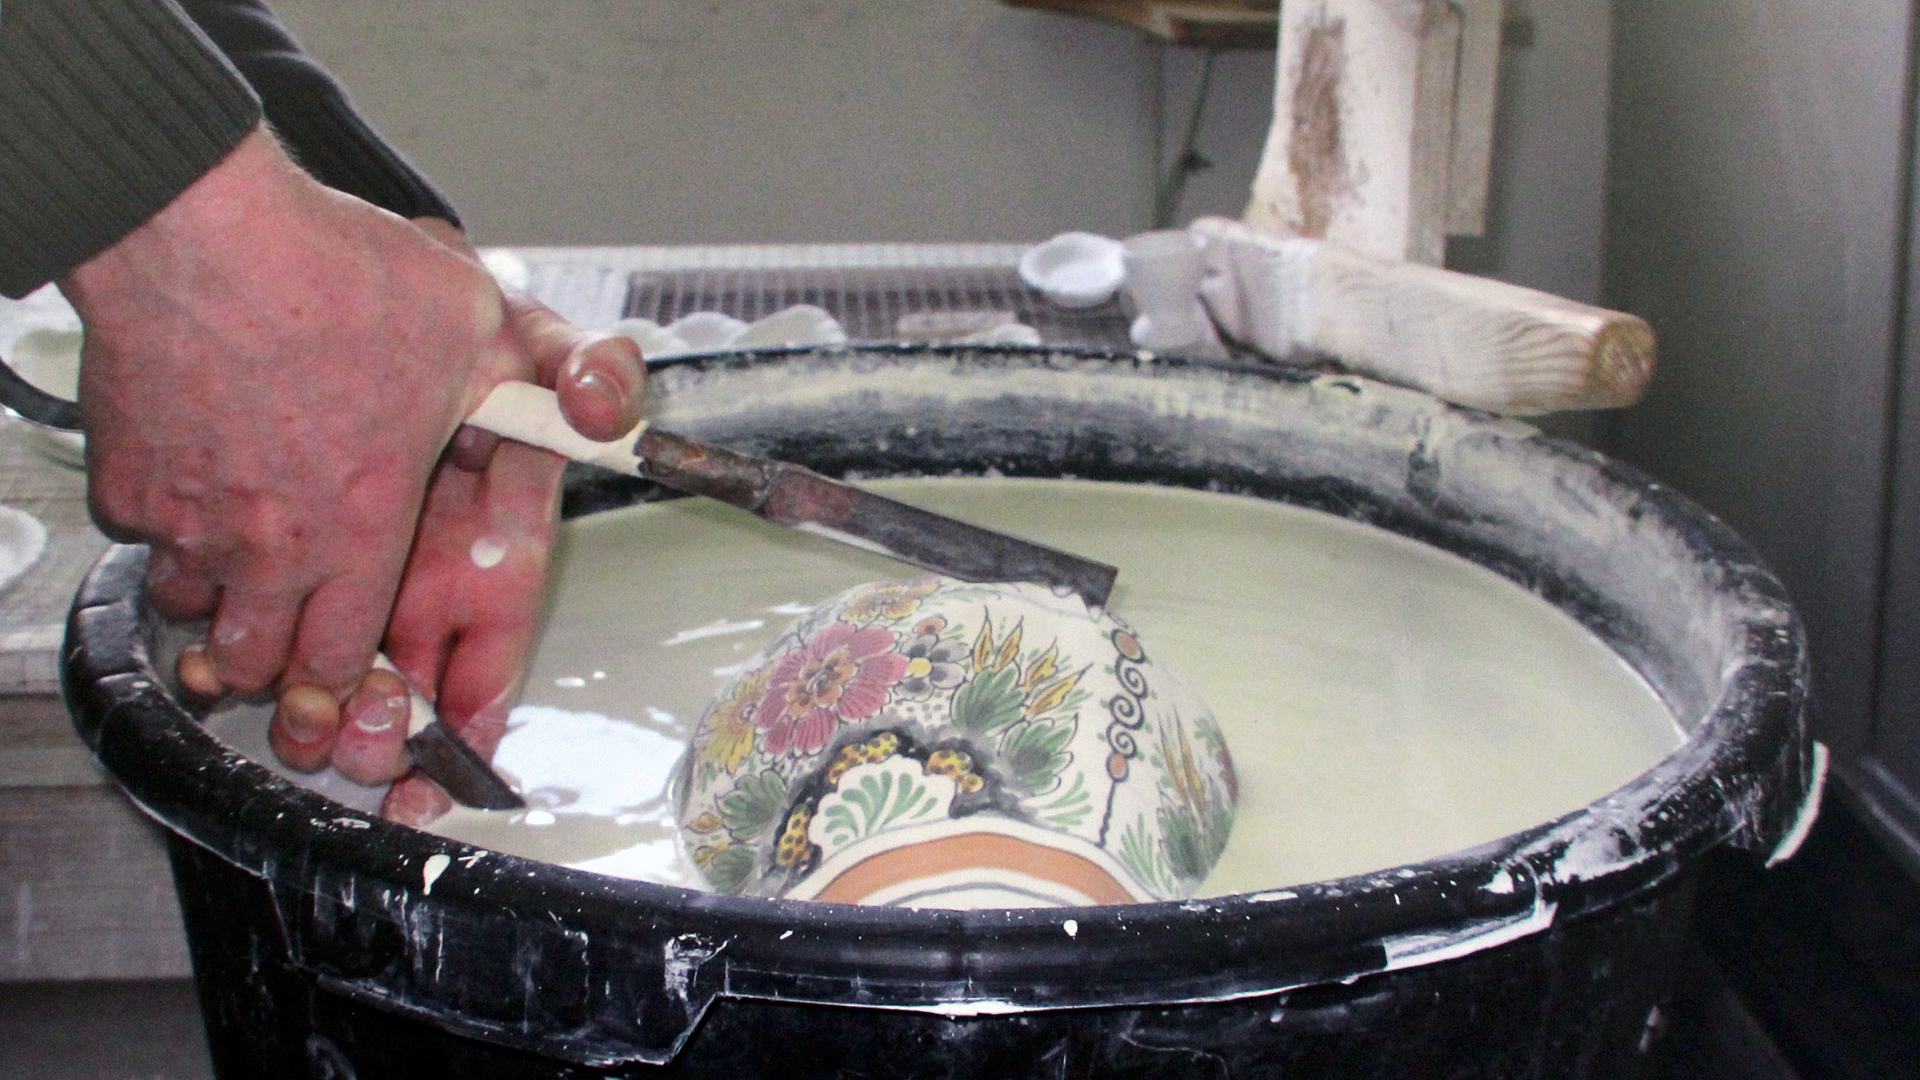
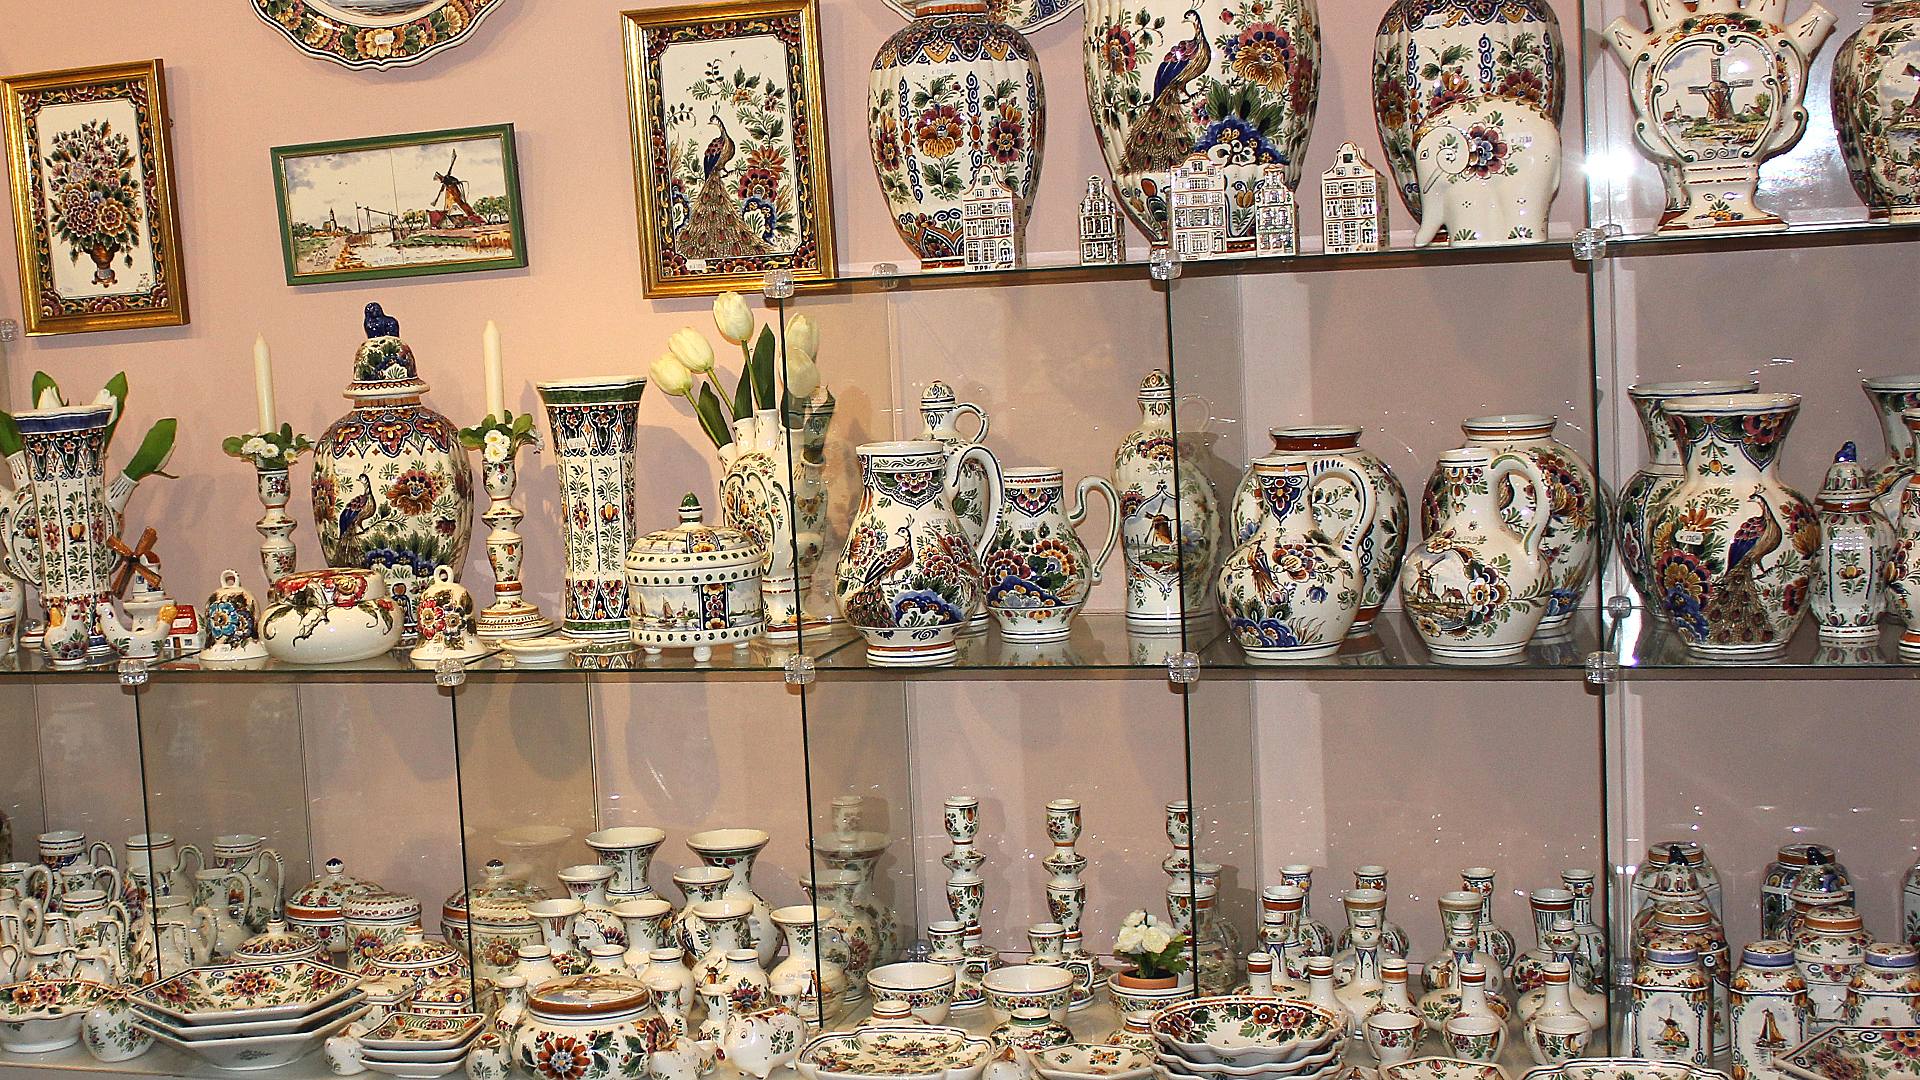
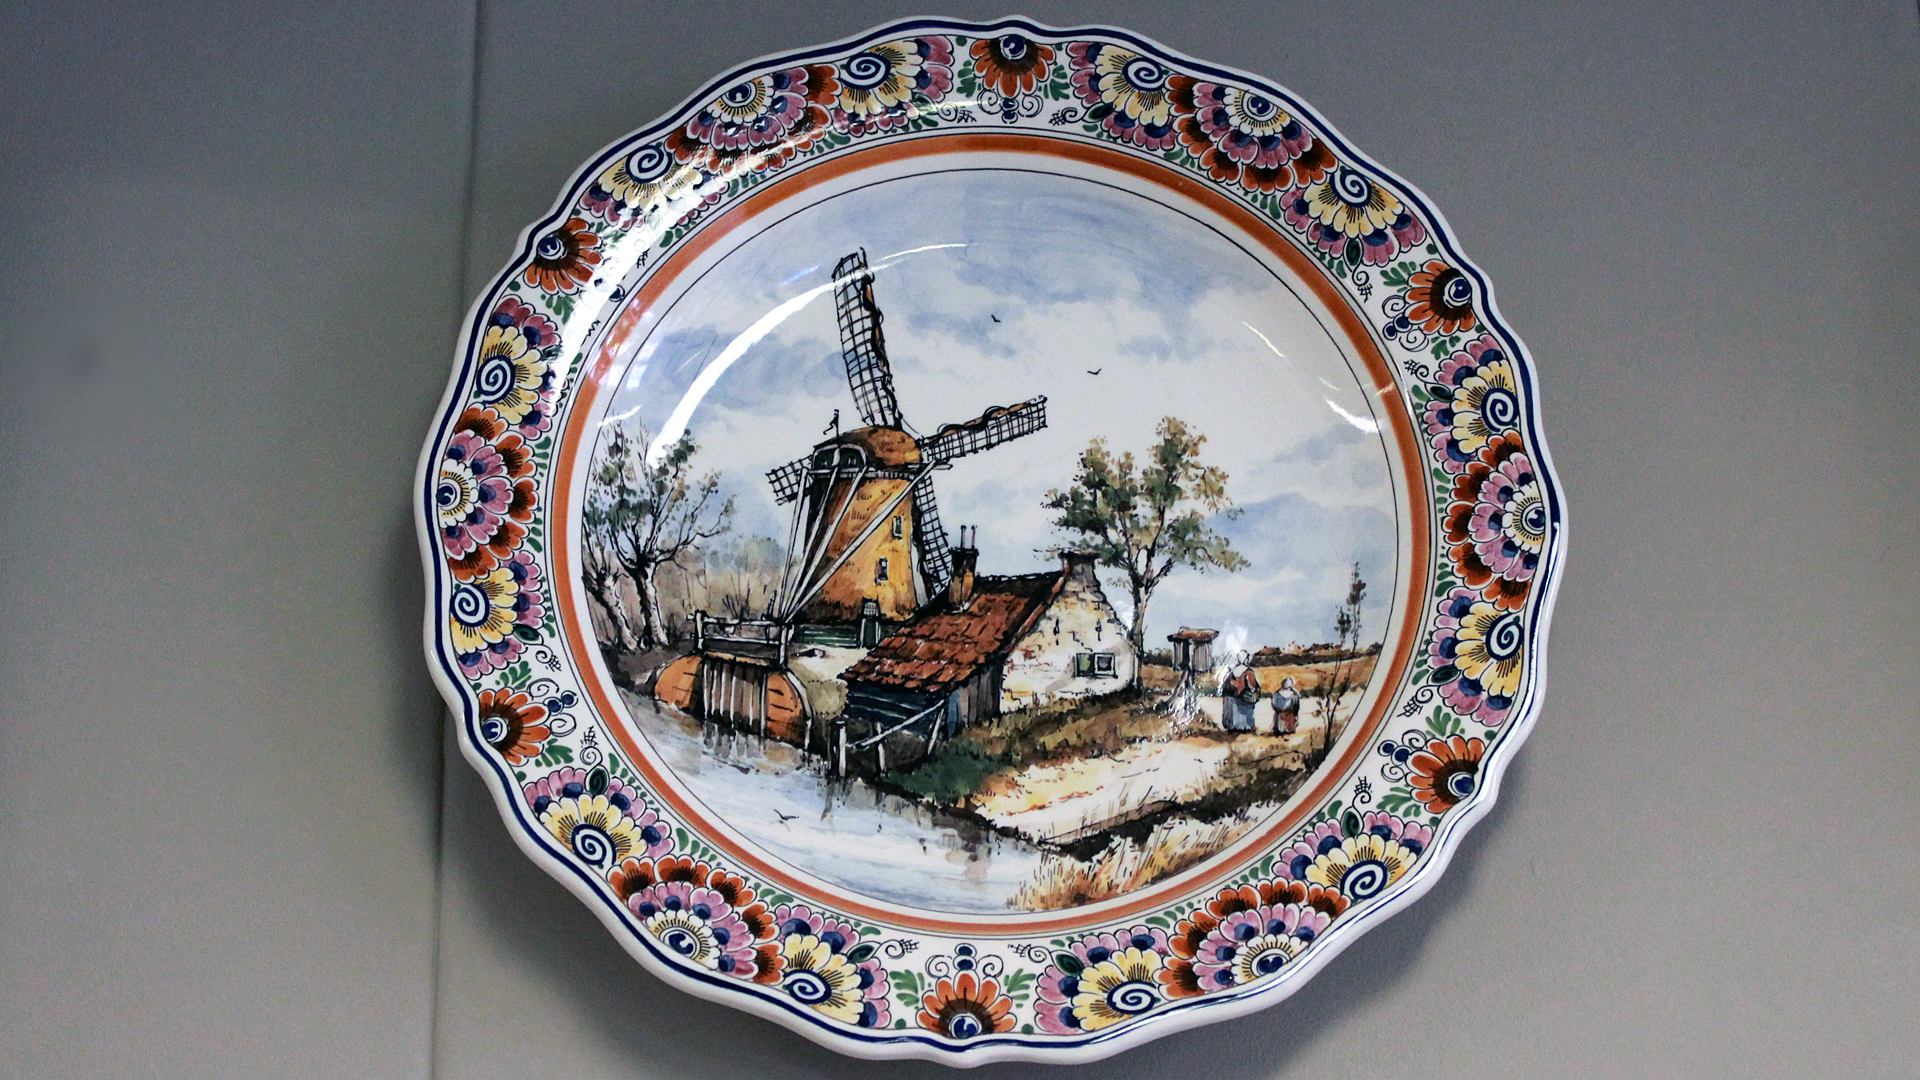
At the factory a tour guide reviewed the step by step process used for making their pottery (some pictures below show the process). First a slurry is poured into a mold and then air dried for several hours. The mold is then emptied of remaining liquid. The mold is opened and the newly formed object removed, it is then placed into a kiln and heated to a very high temperature for several hours. The kiln then cools for 24 hours before opening and the objects are then removed from the mold, marked with paint lines and hand painted, then glazed, and cured in the kiln again. The last heating and curing results in a color change and a hardening of the object.
Delft Pottery

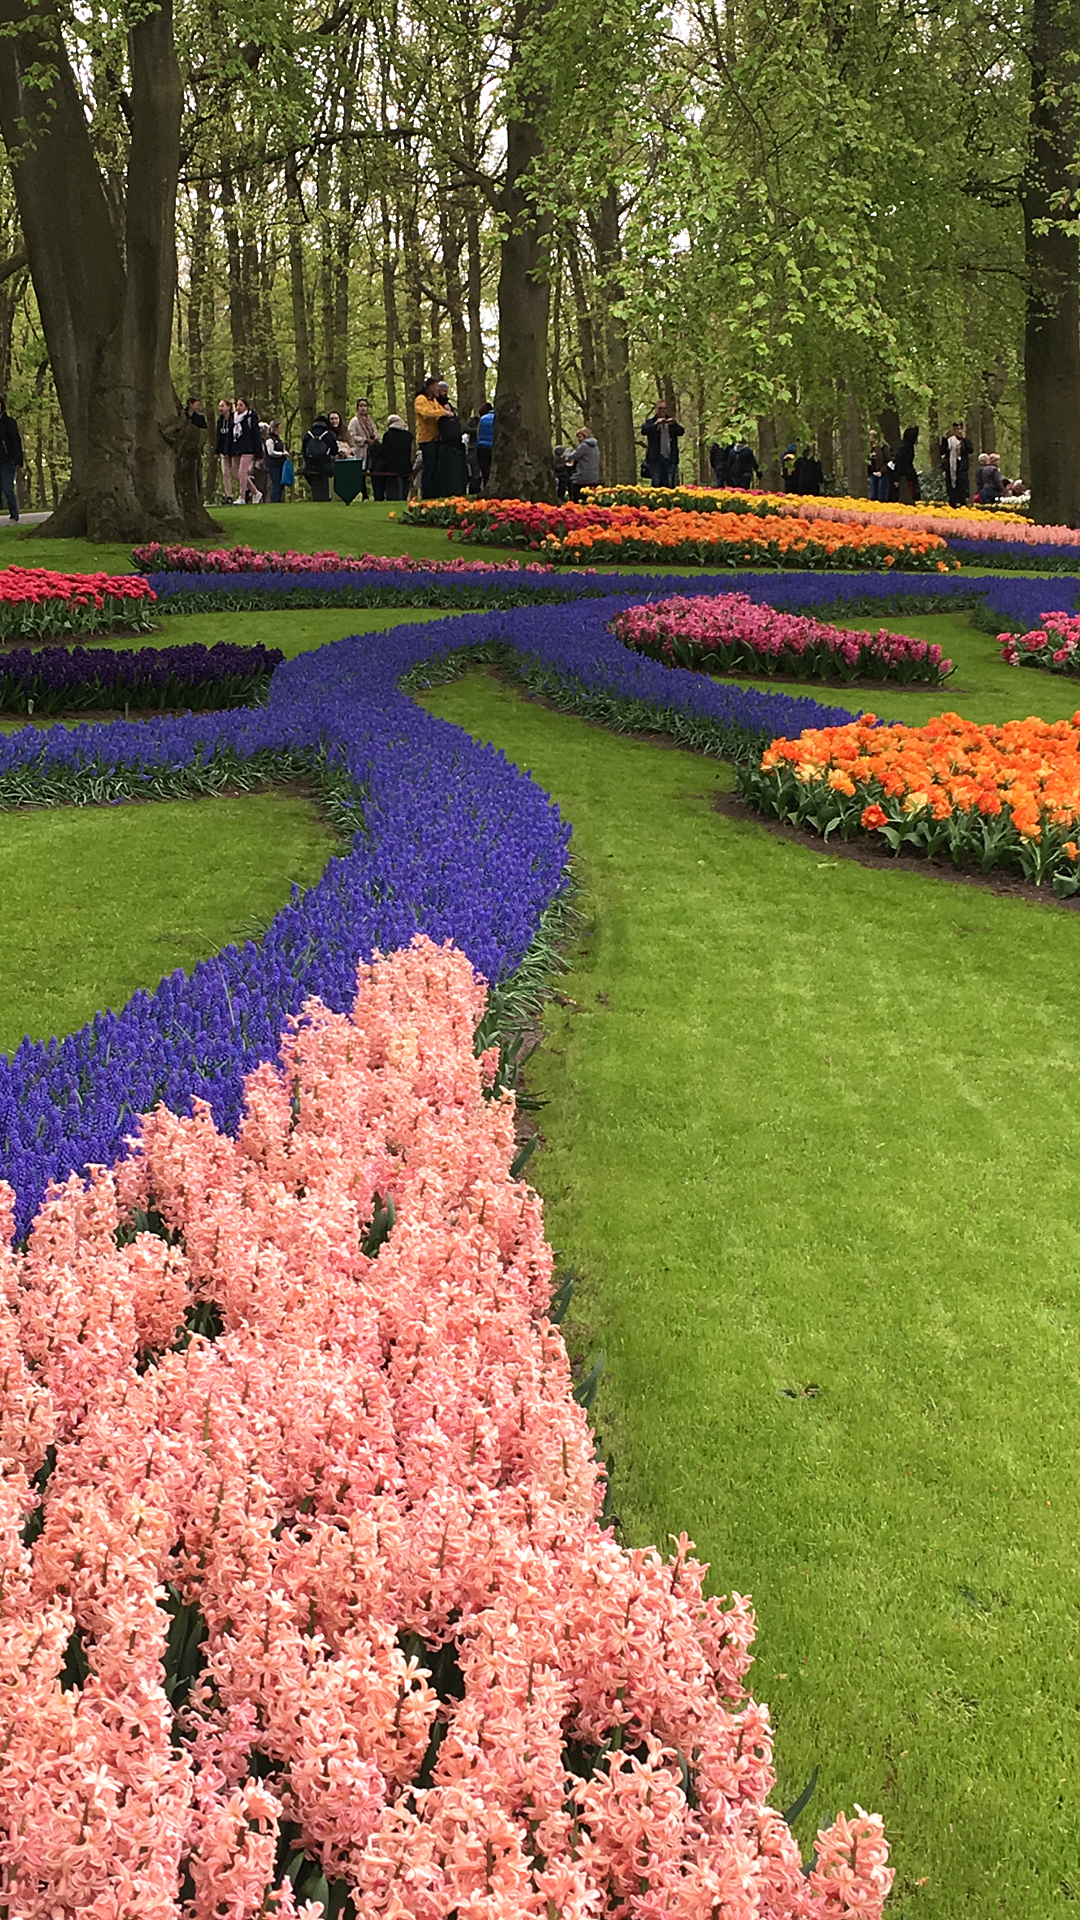
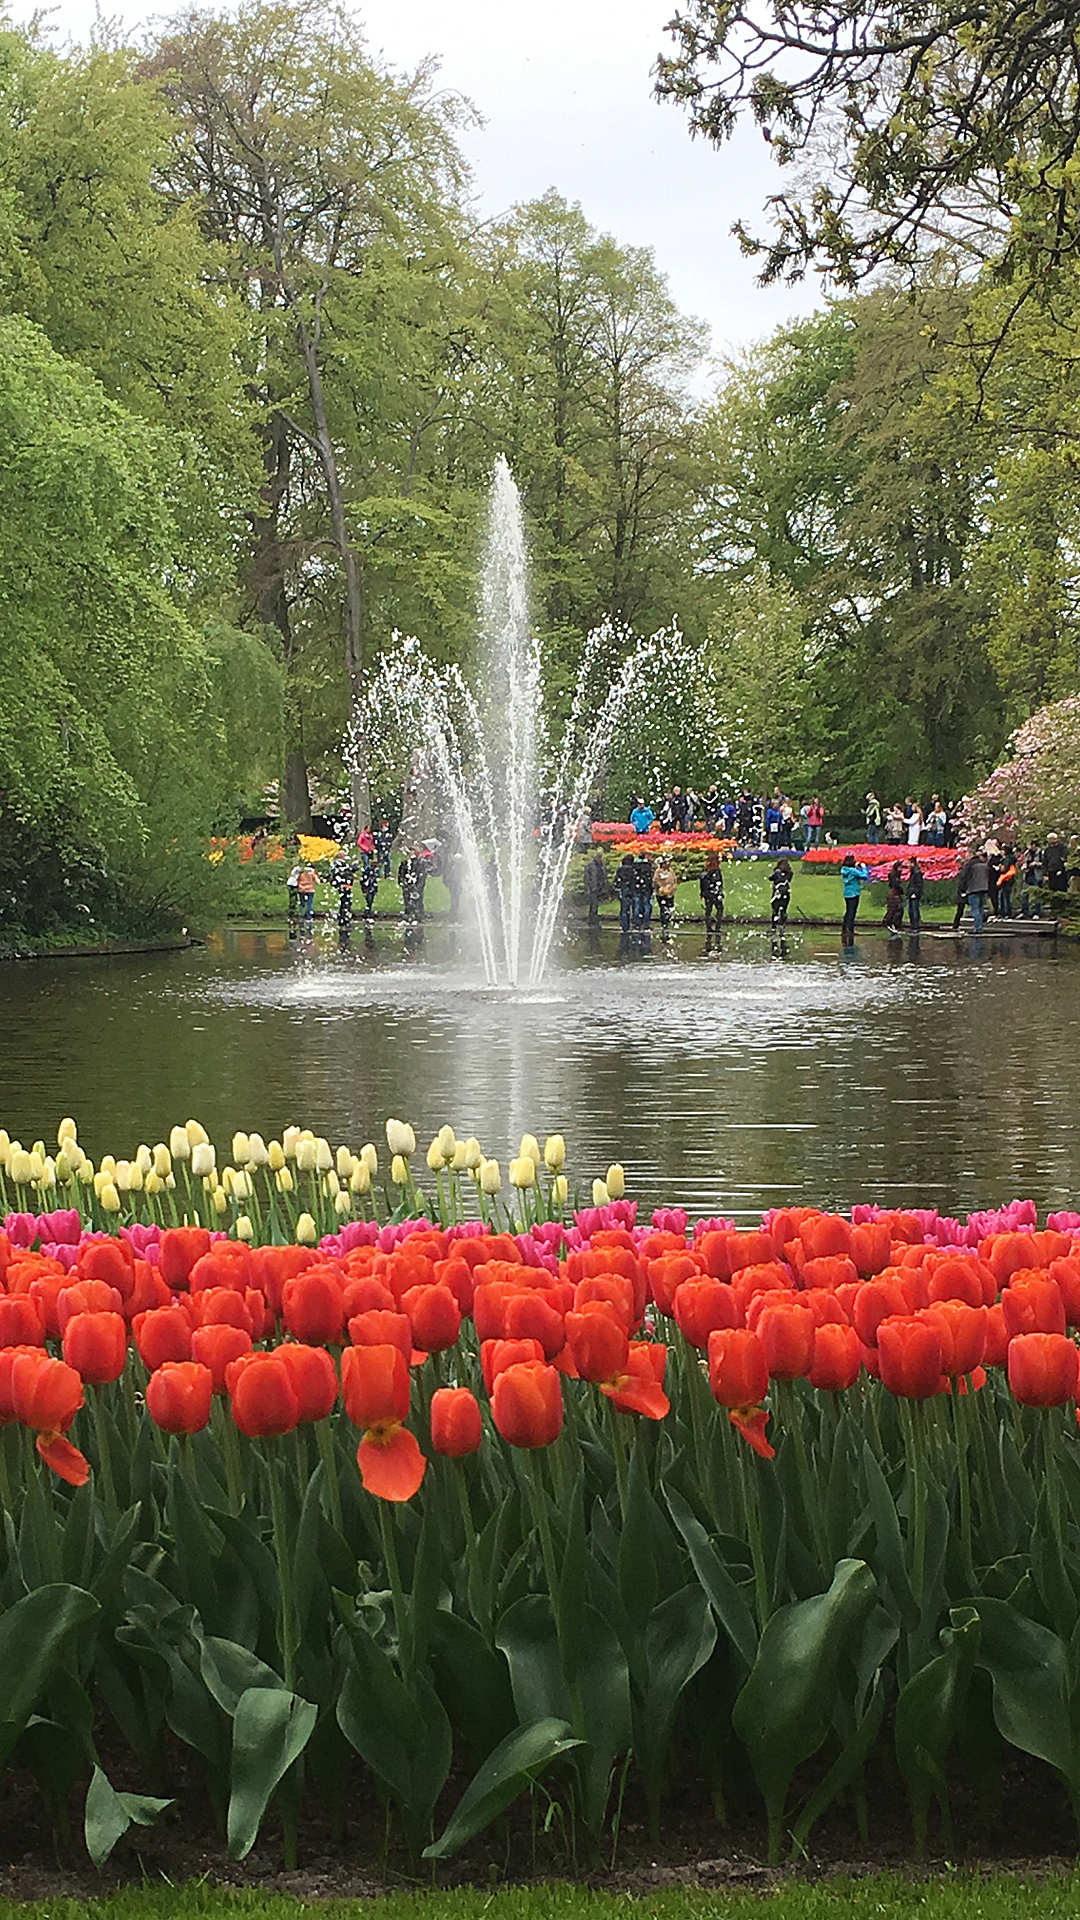
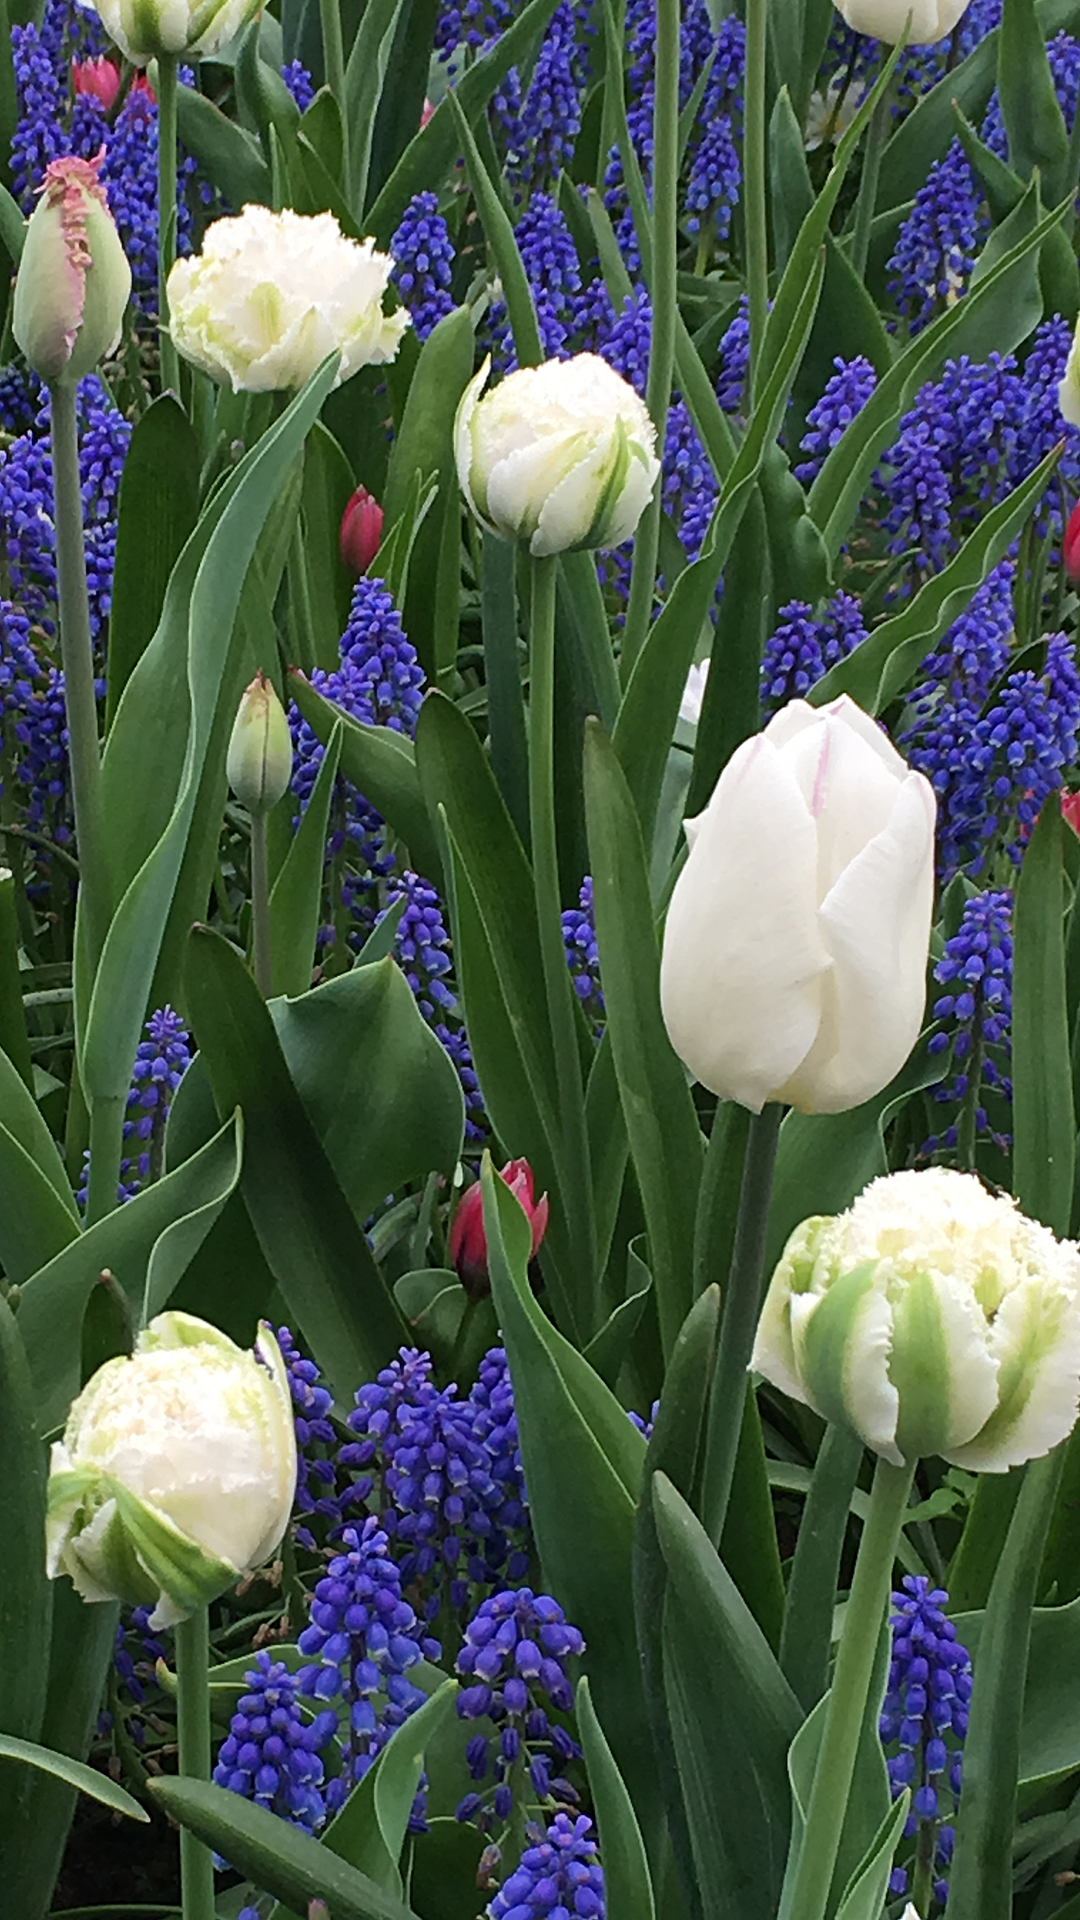
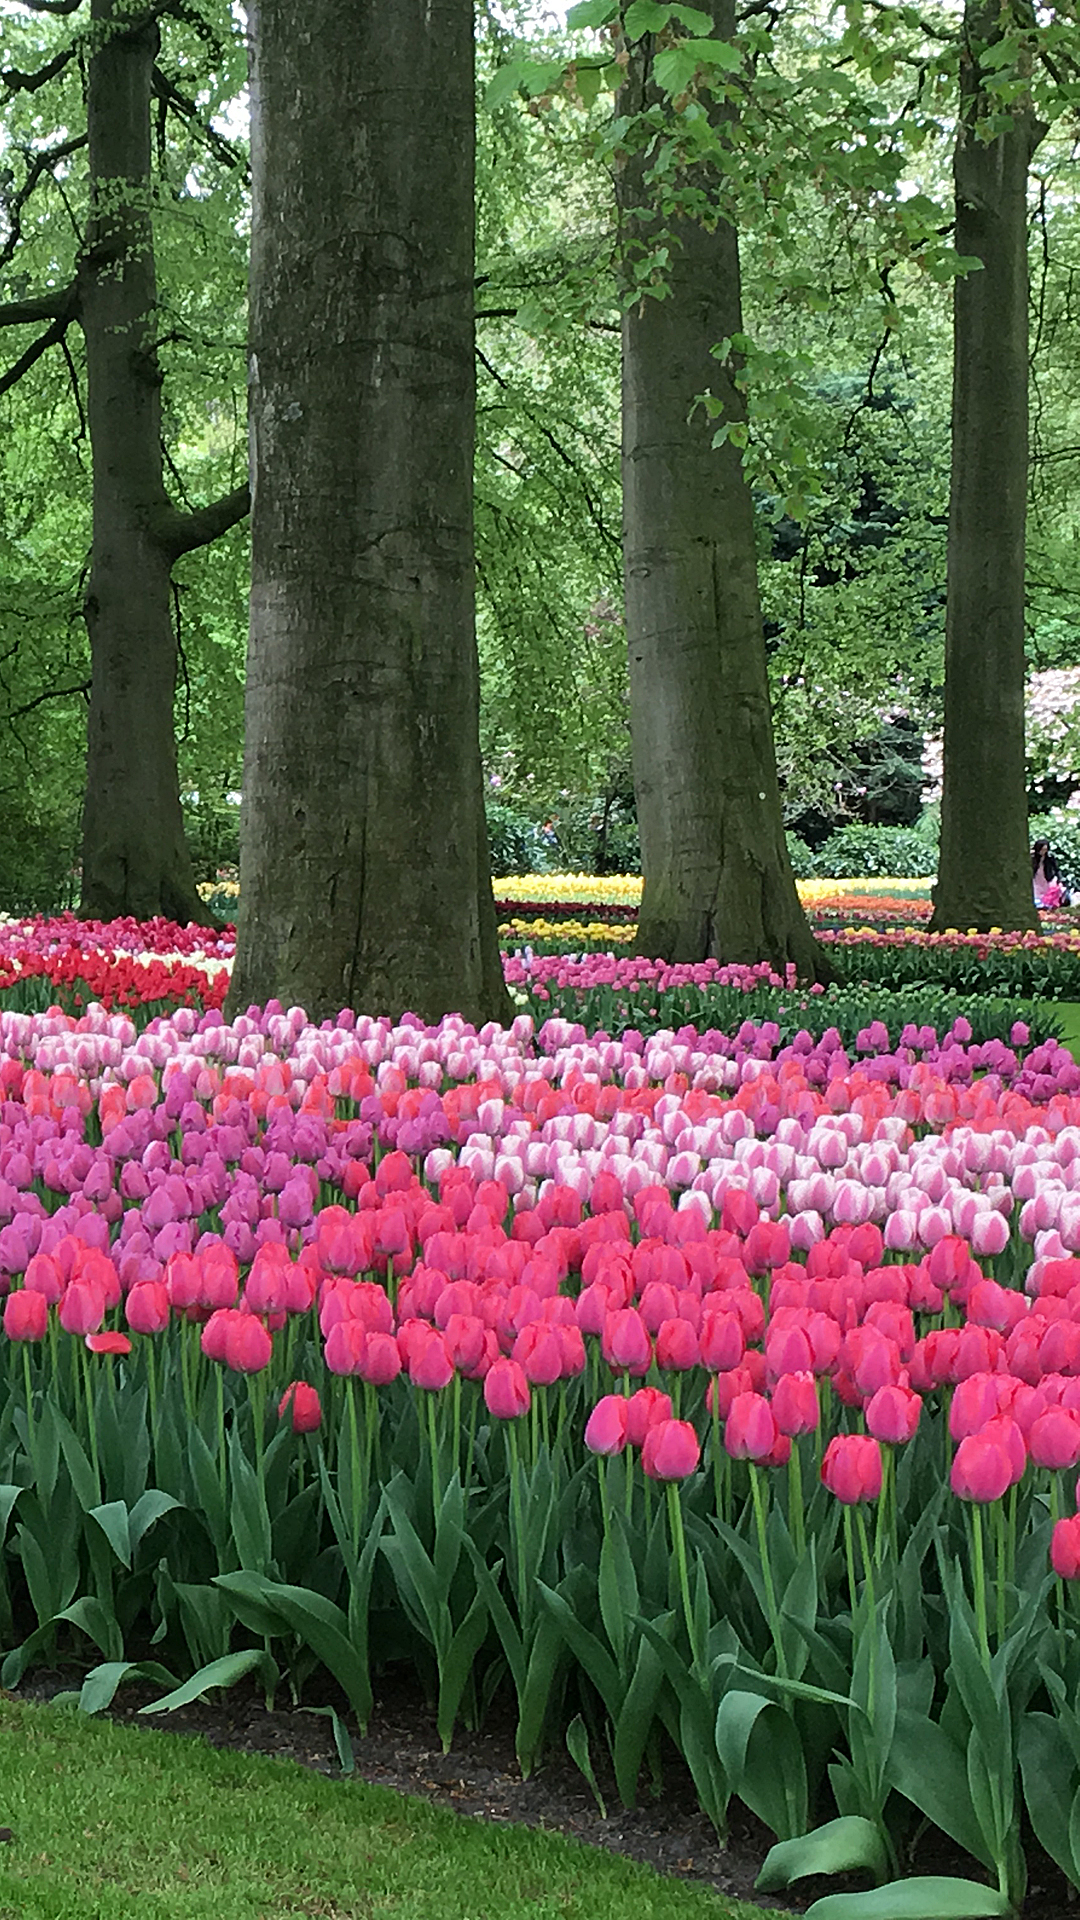
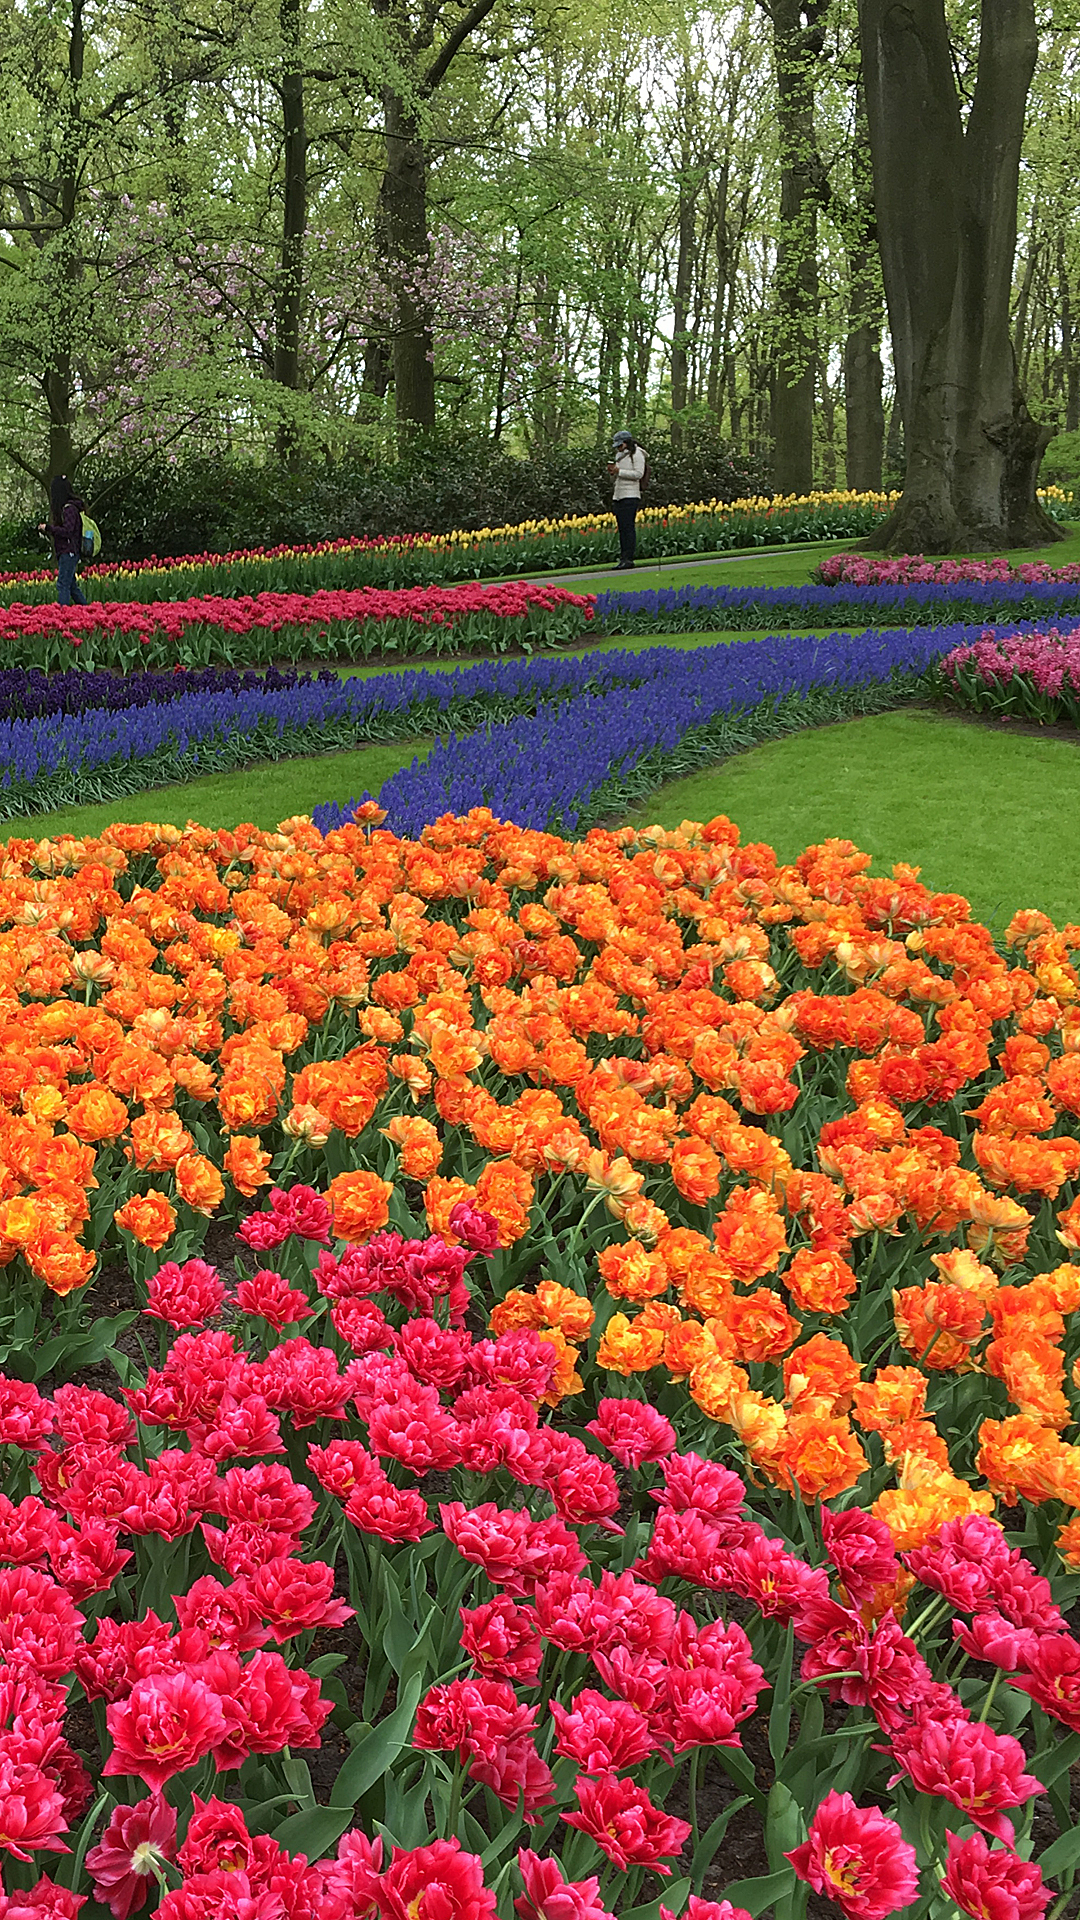
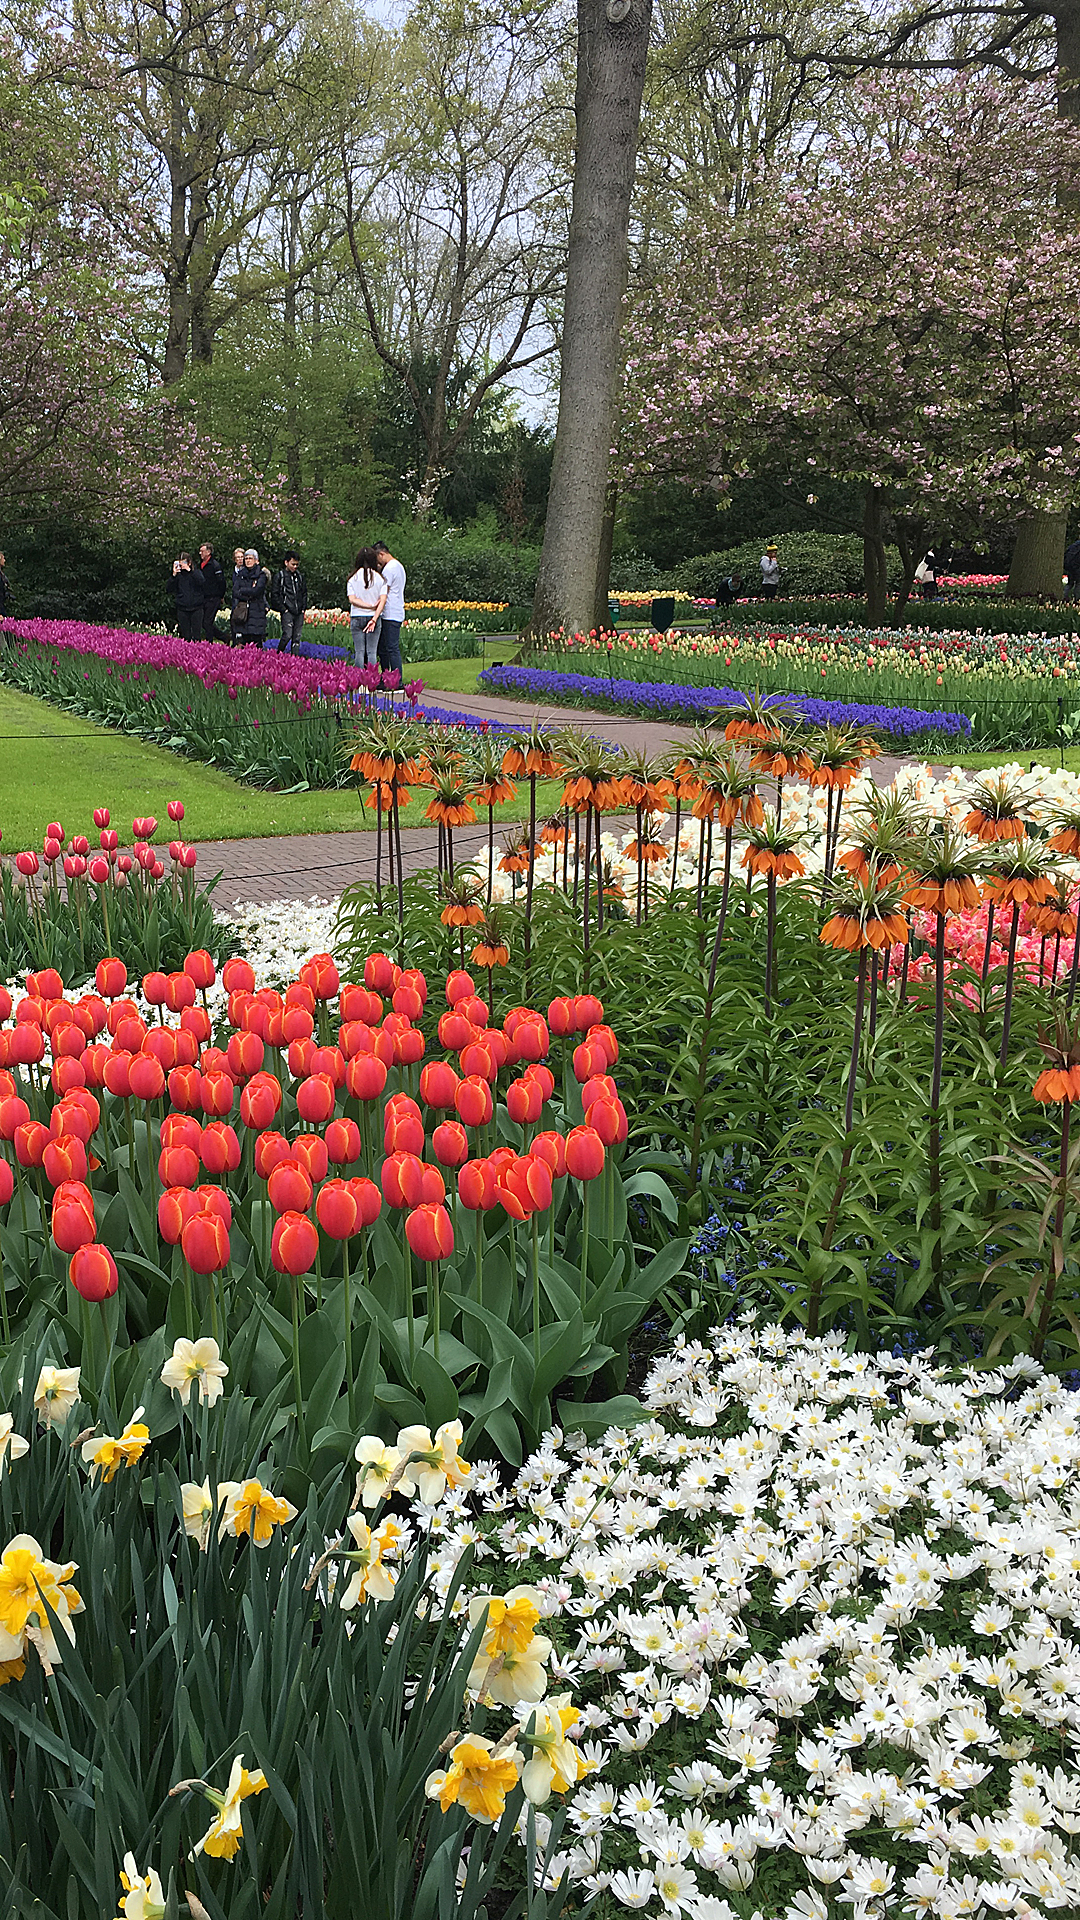
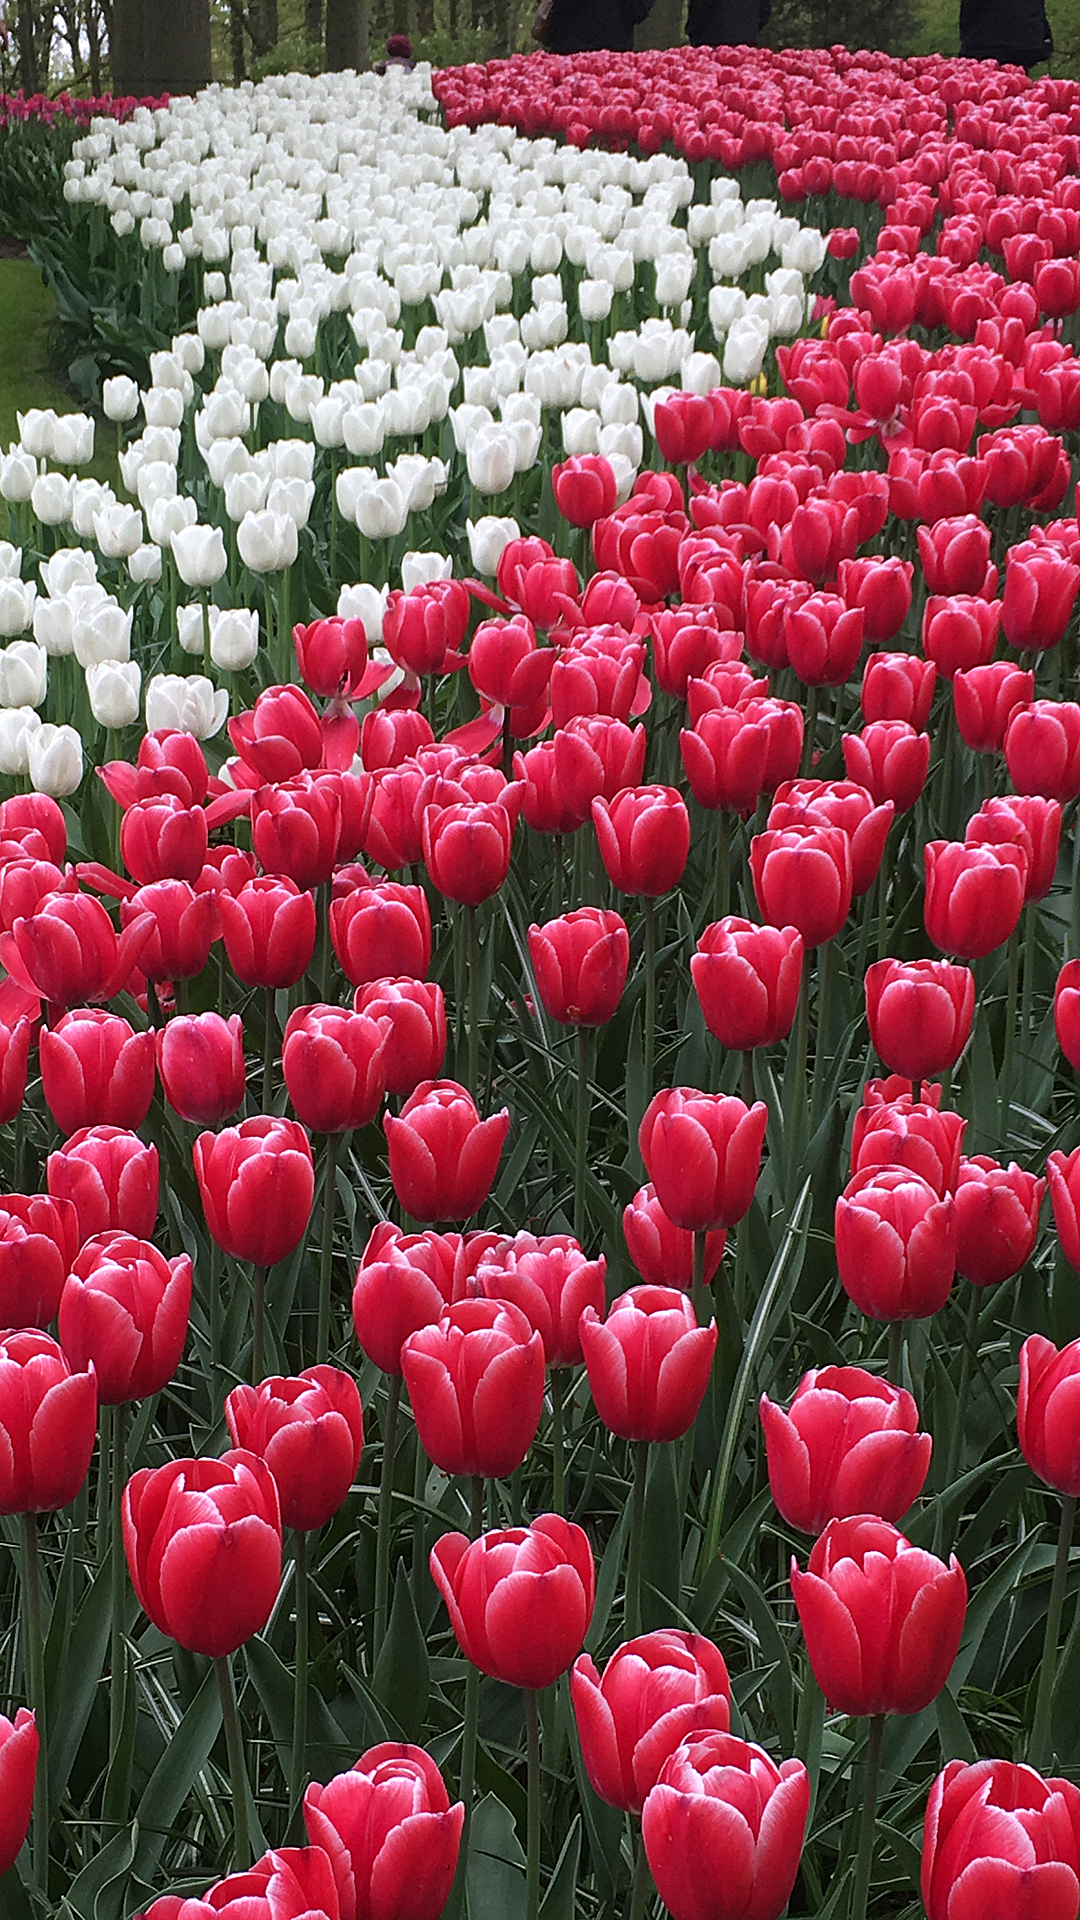
Keukenhof Gardens, Rotterdam, Netherlands
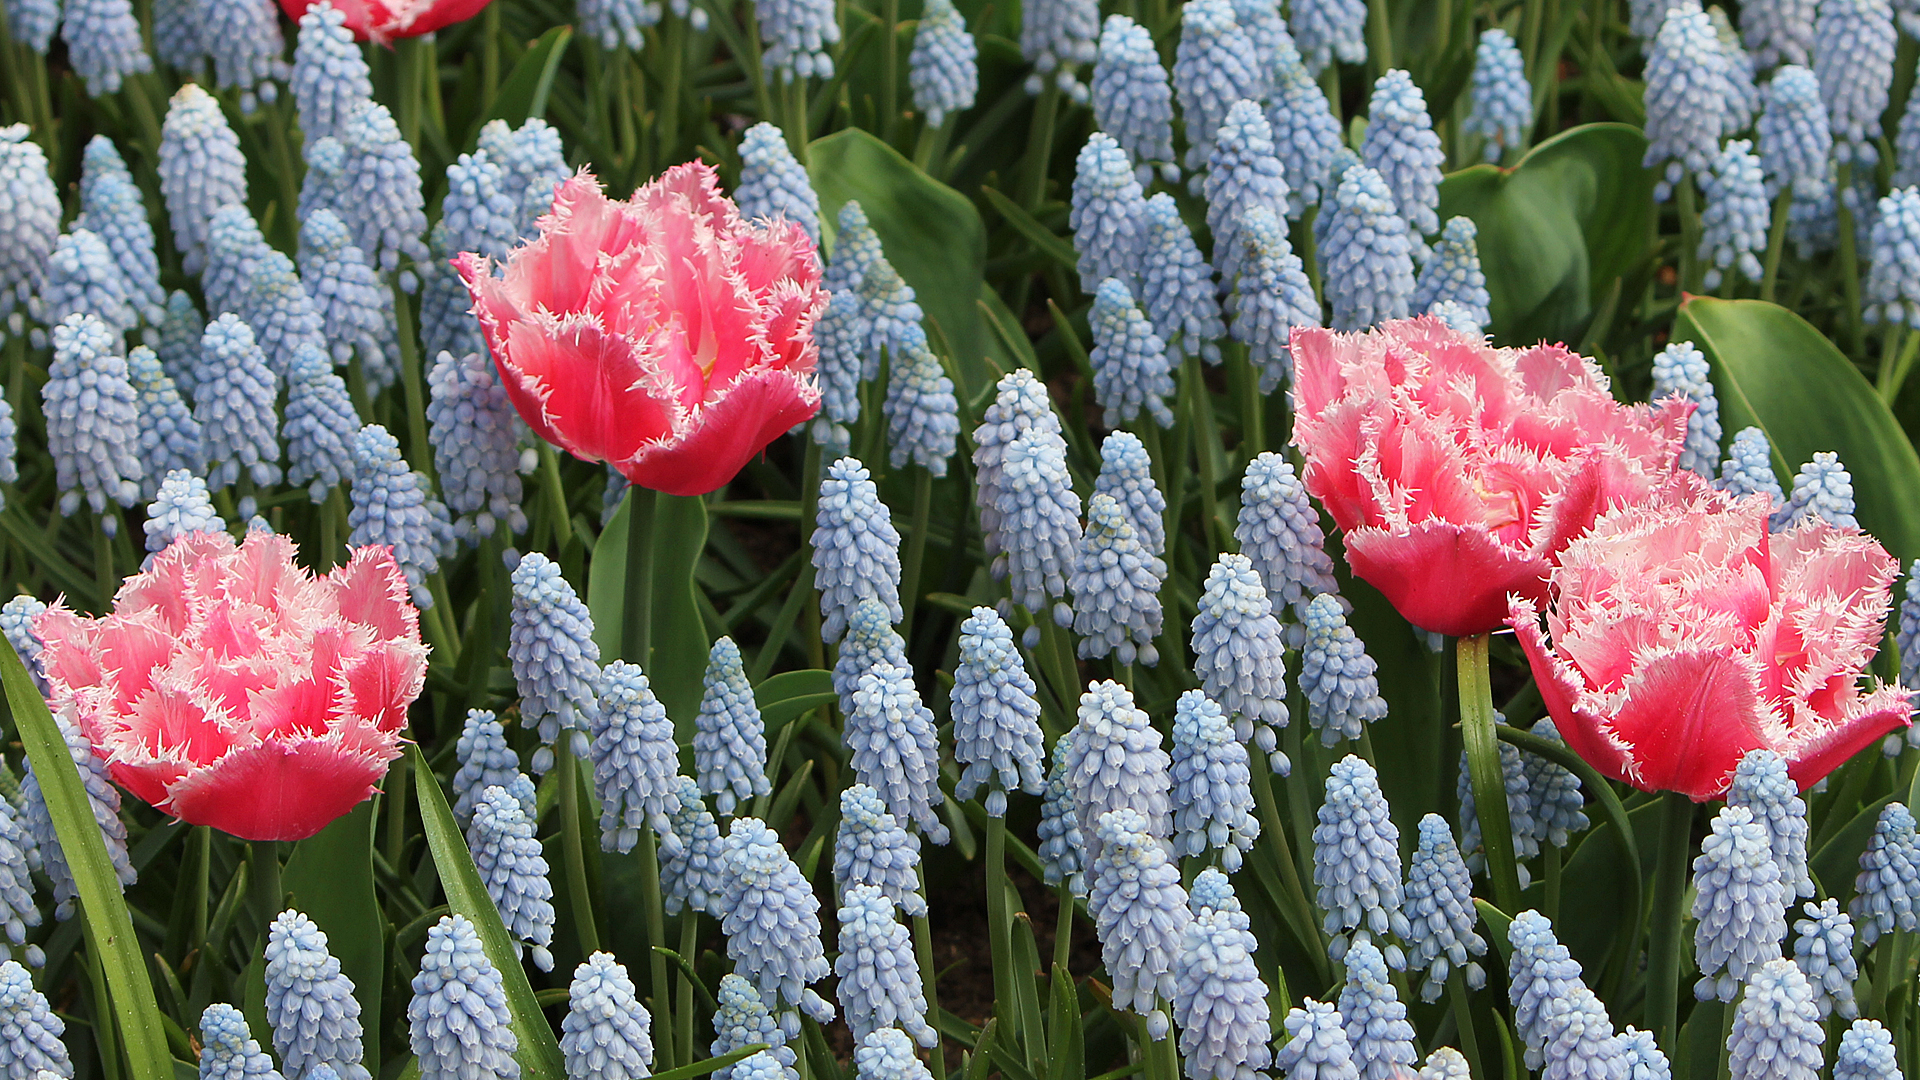
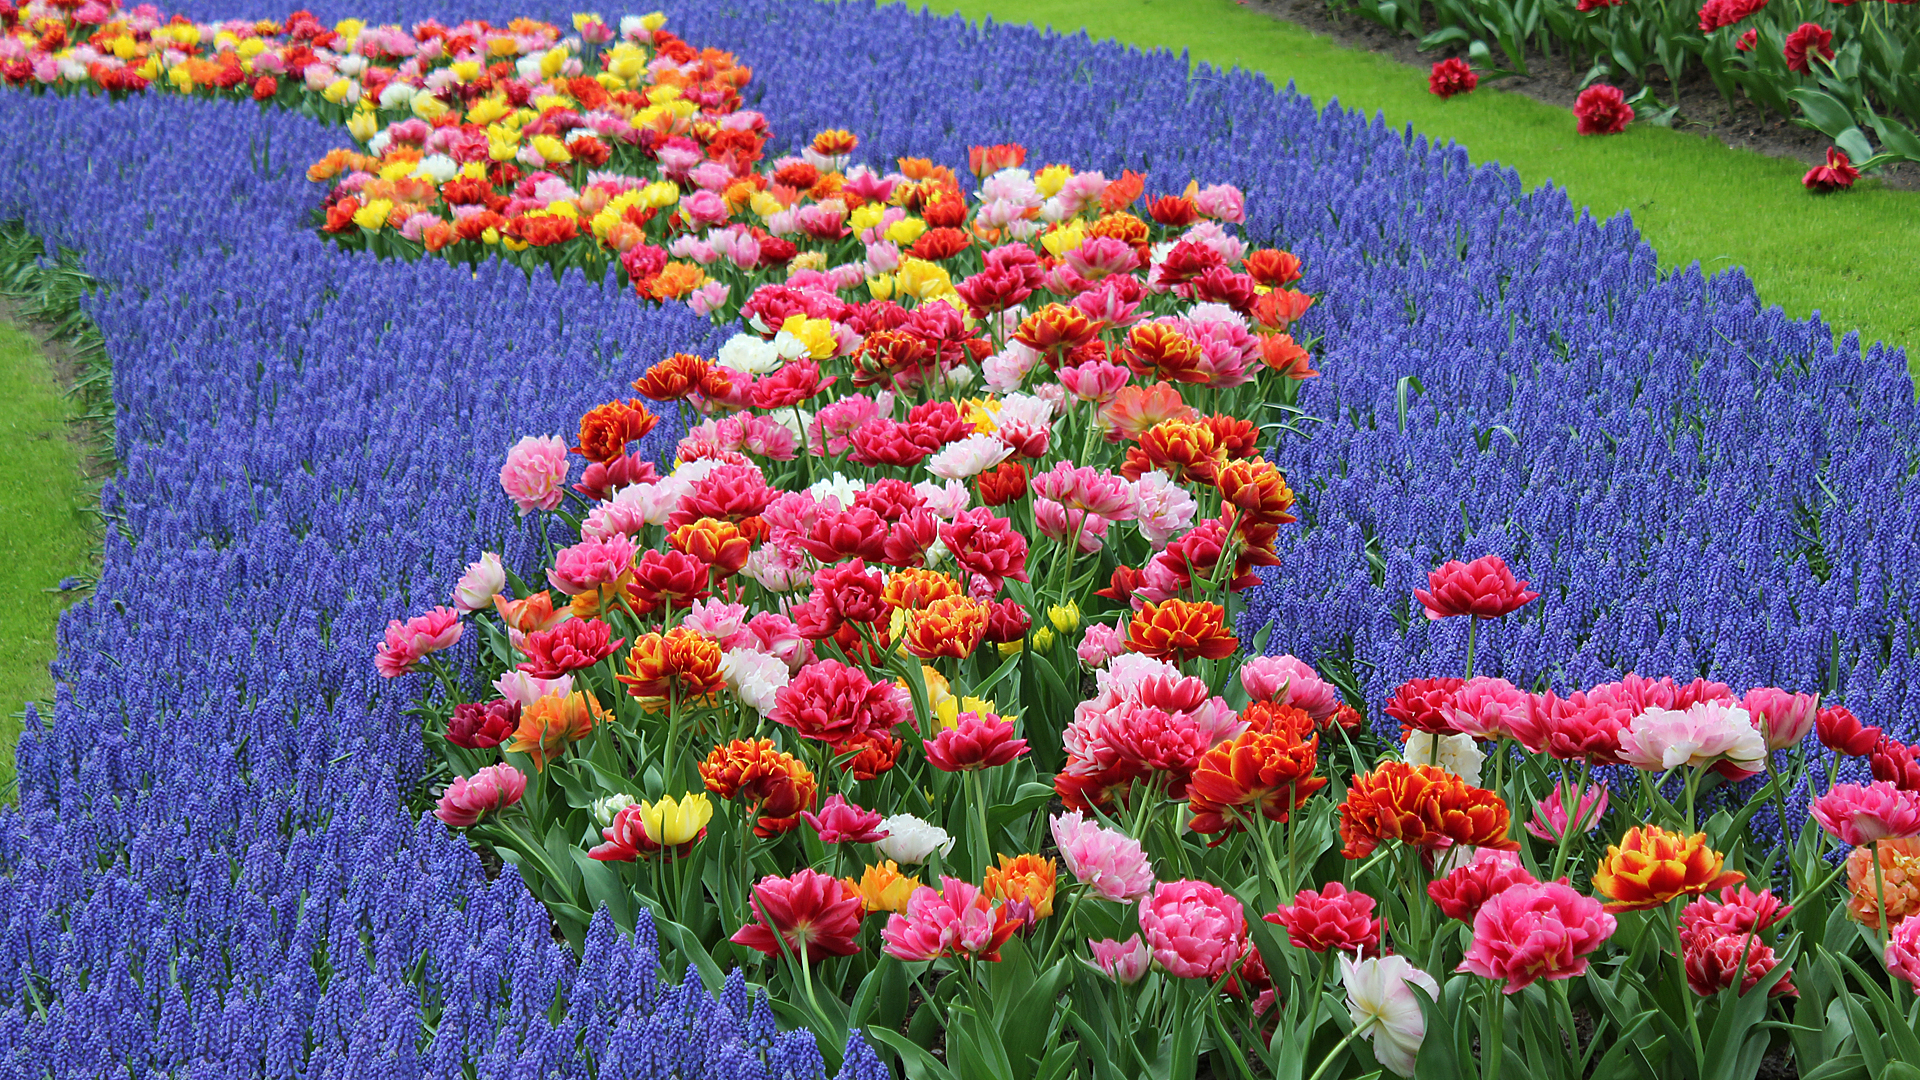
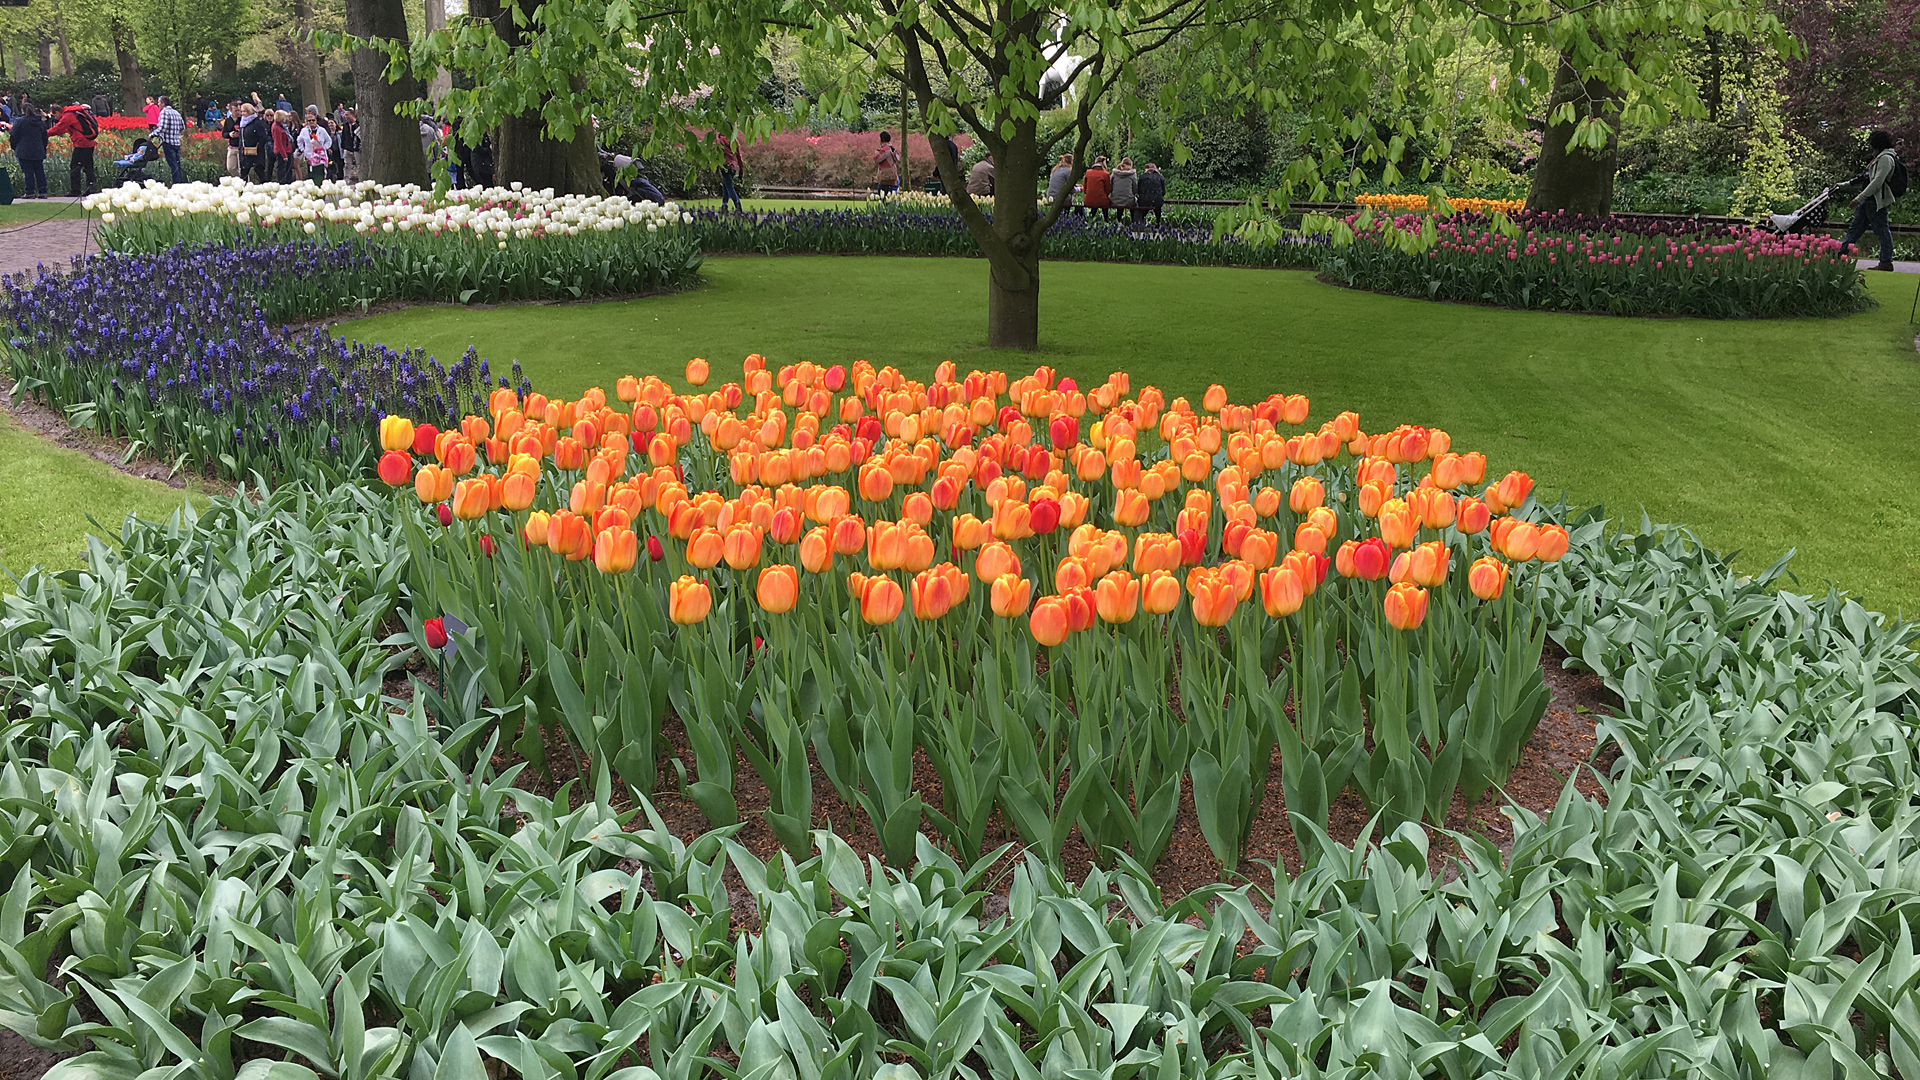
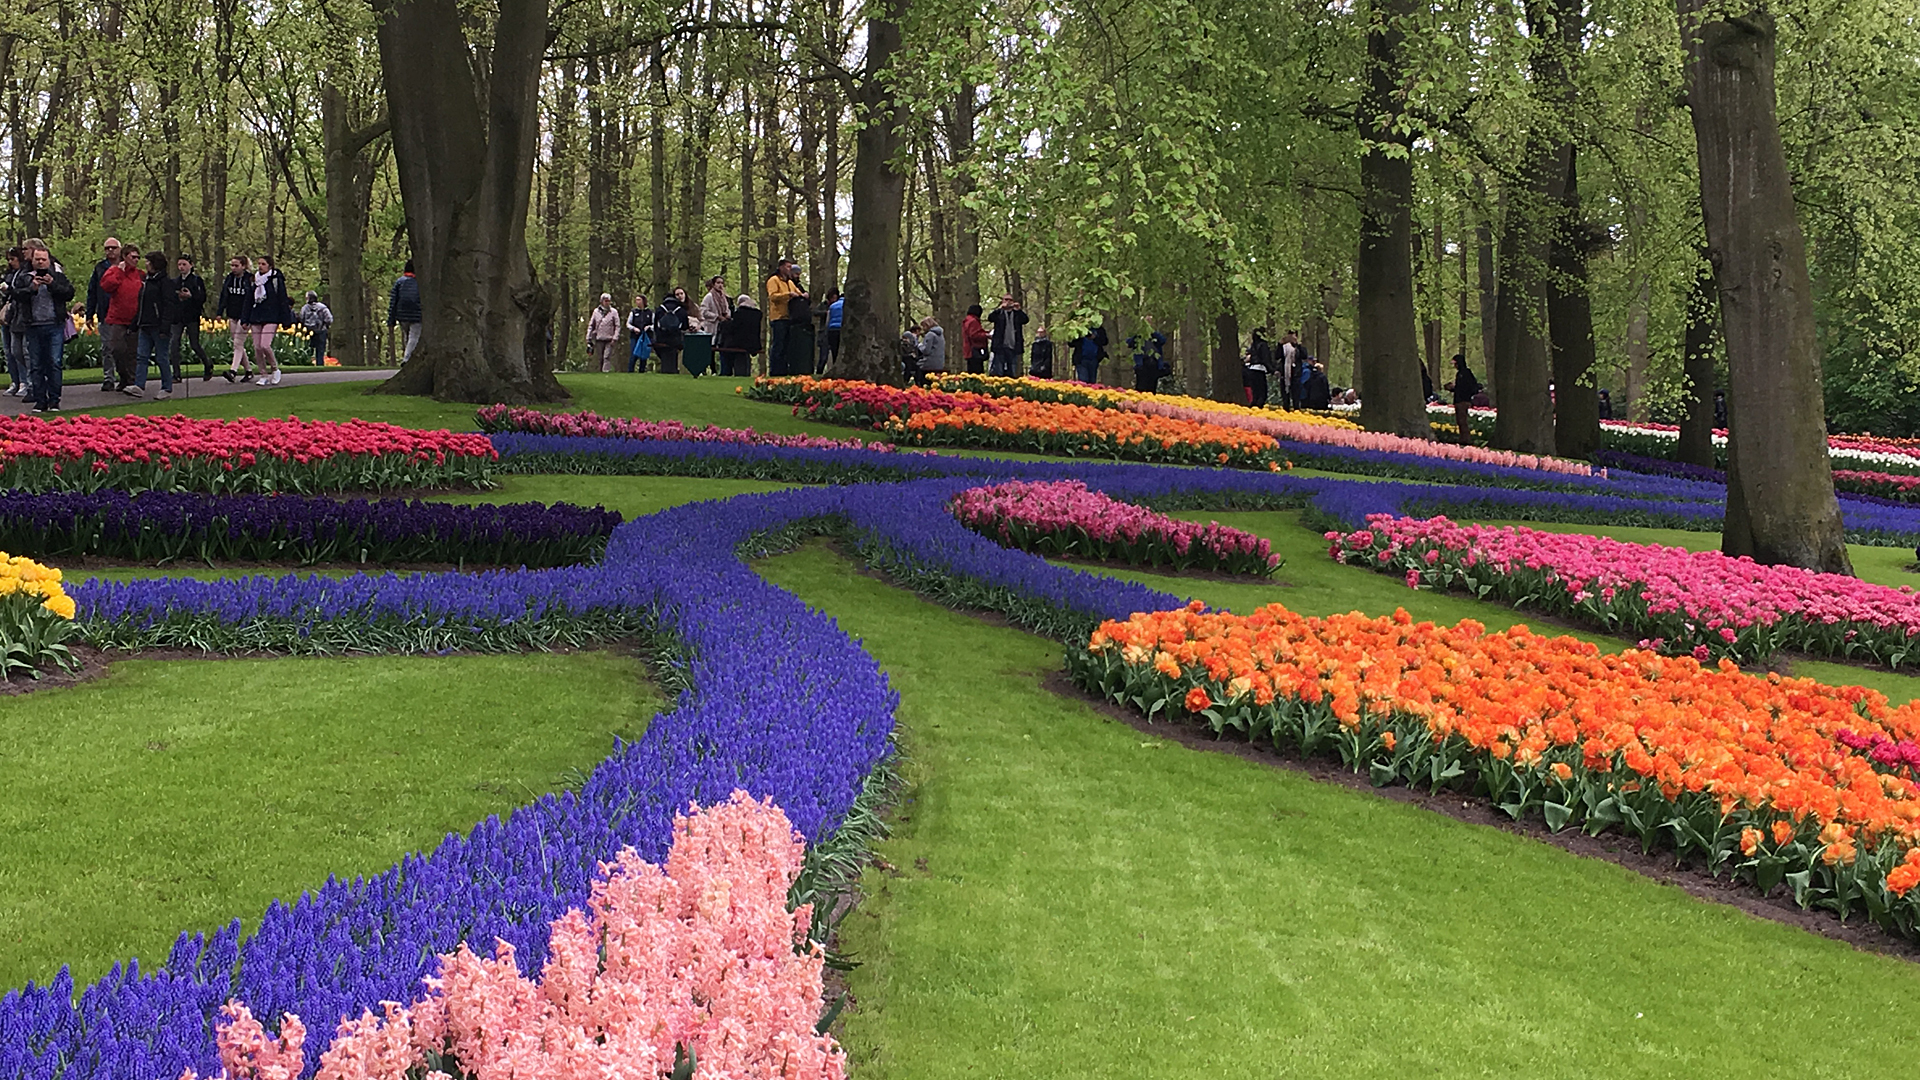
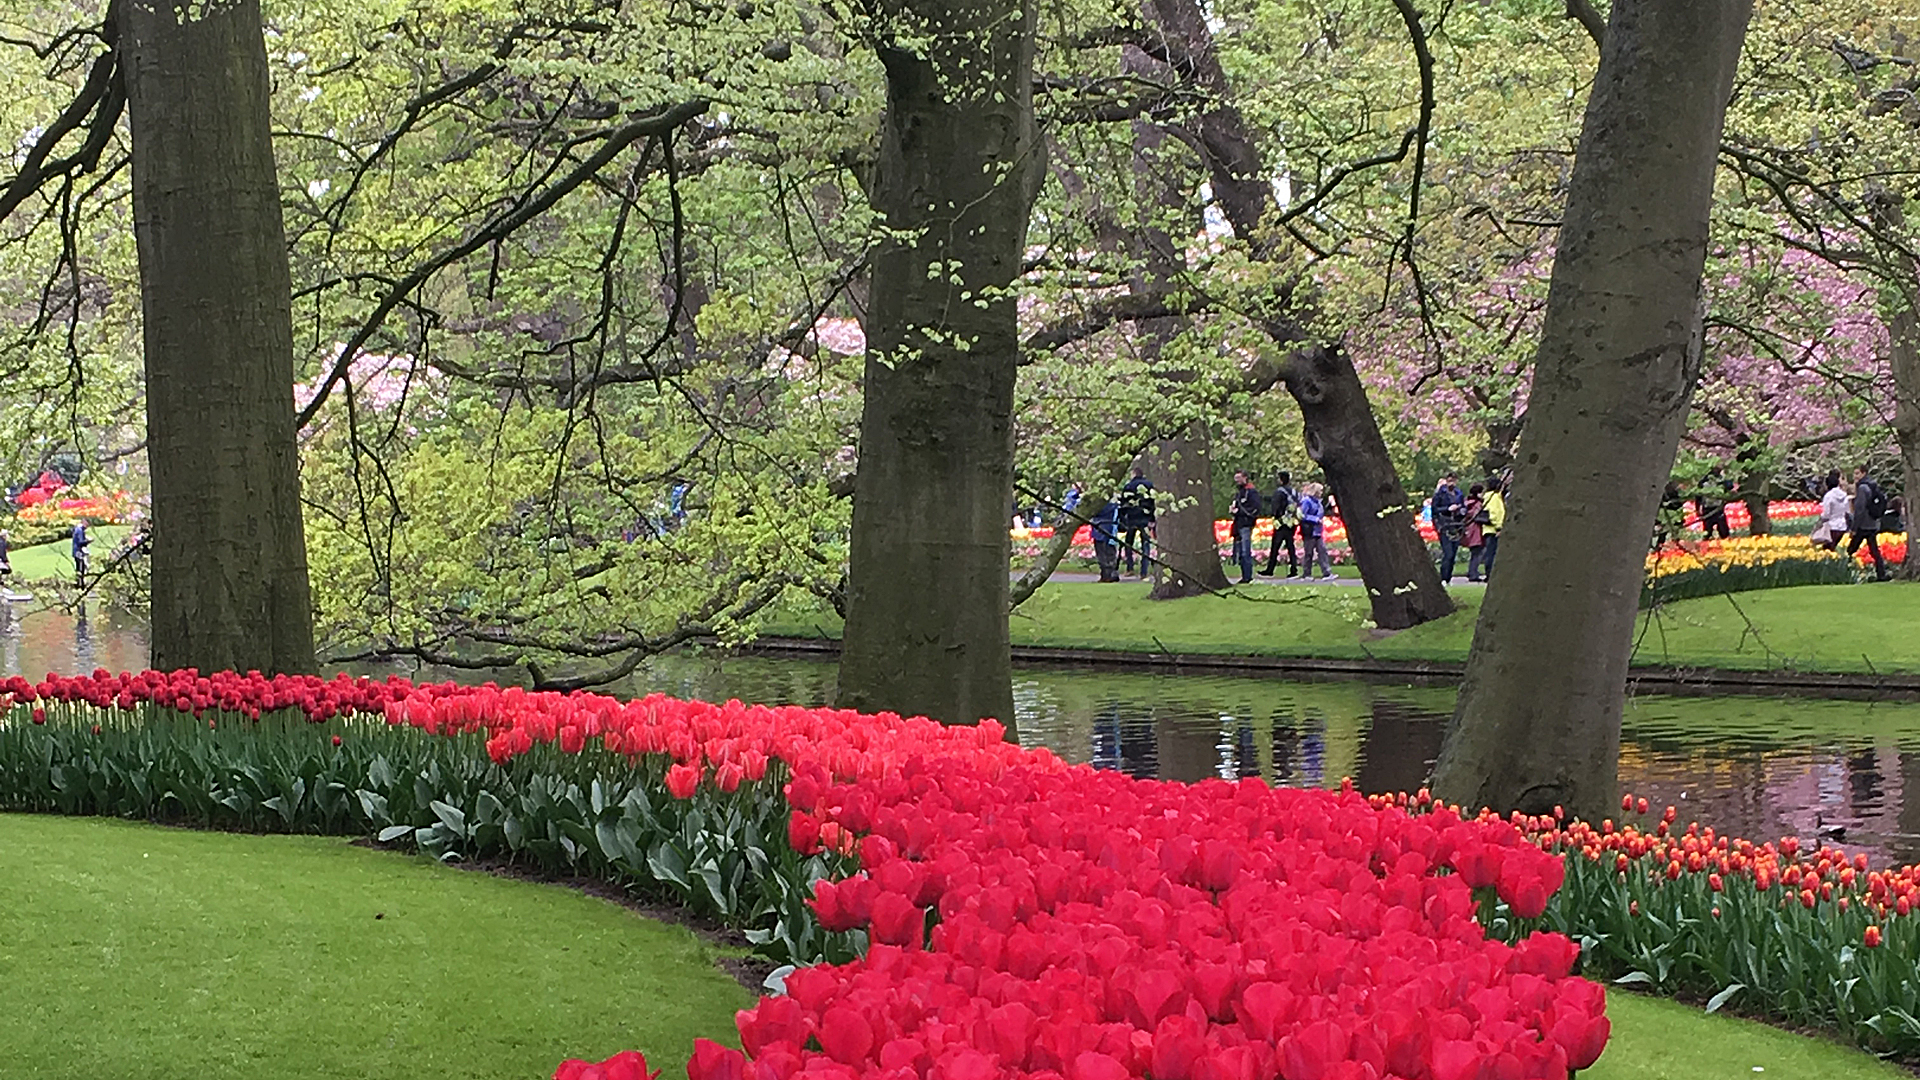
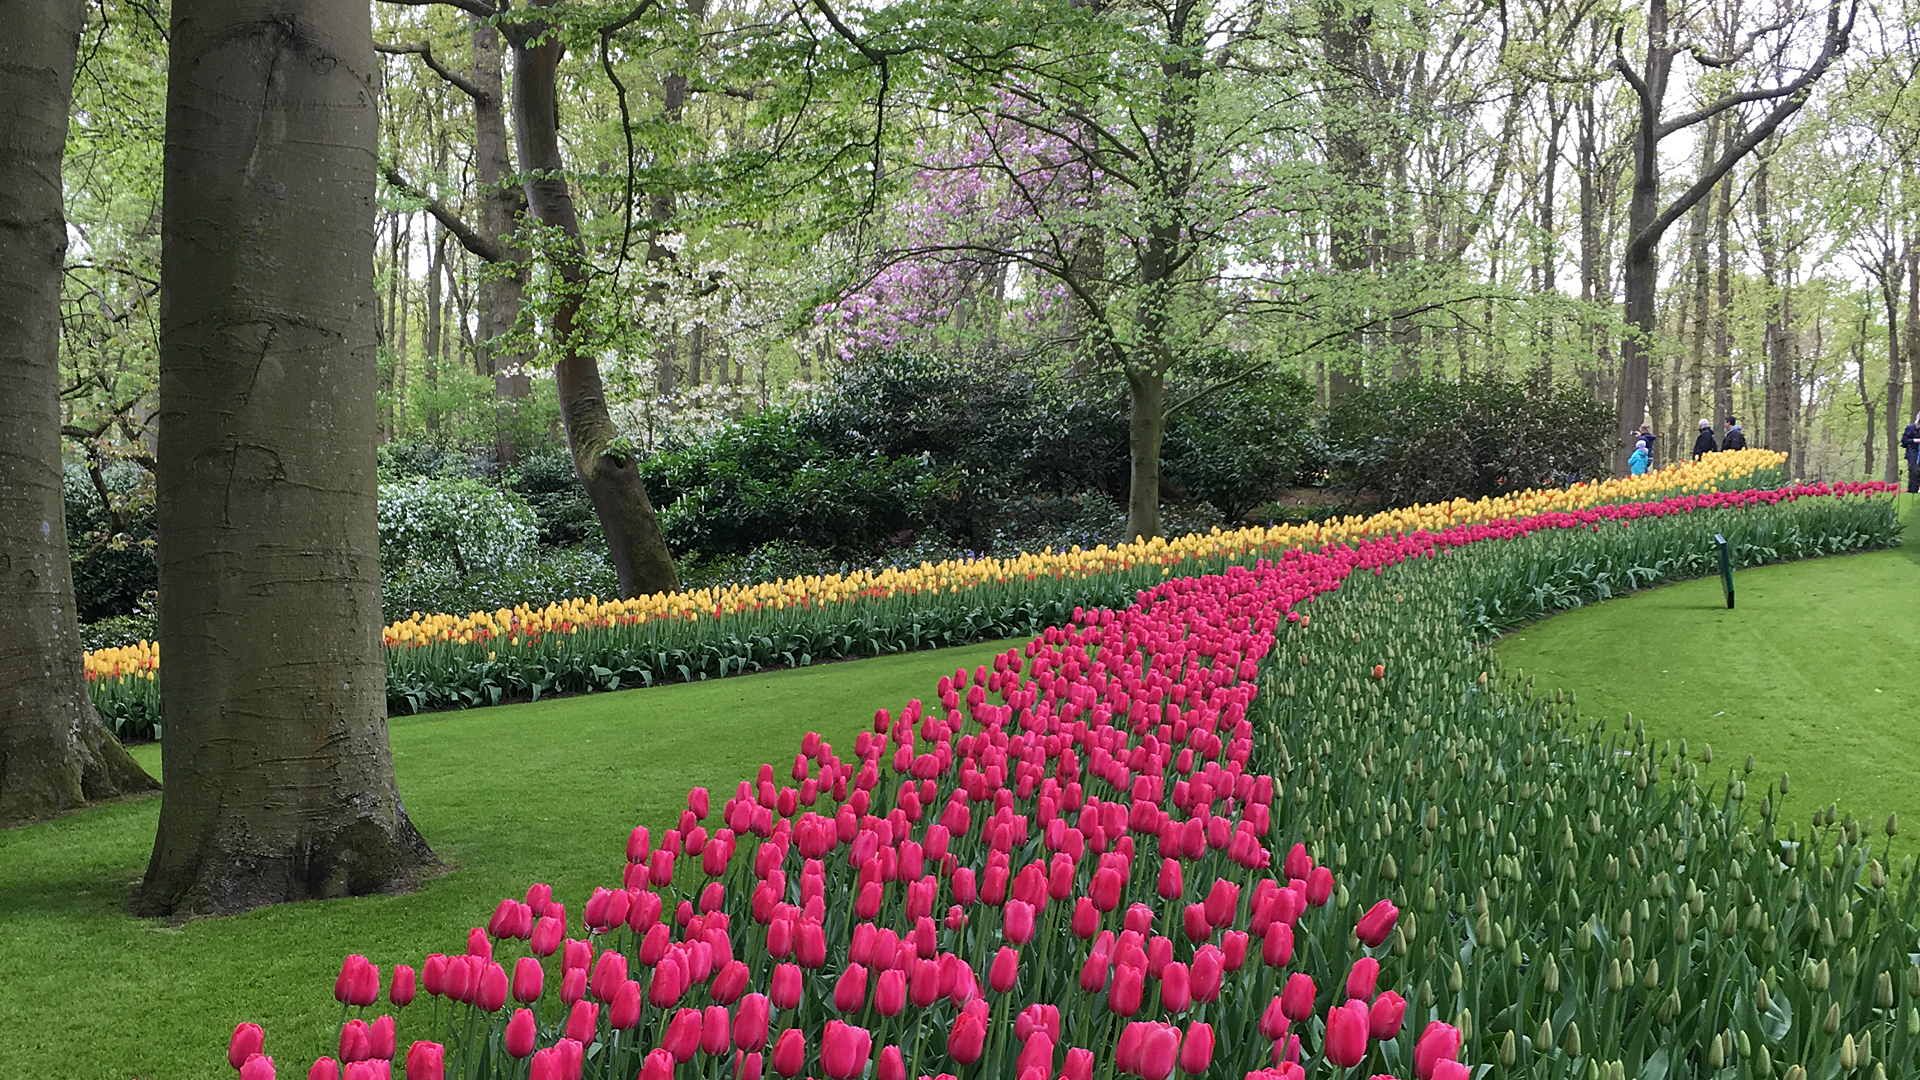
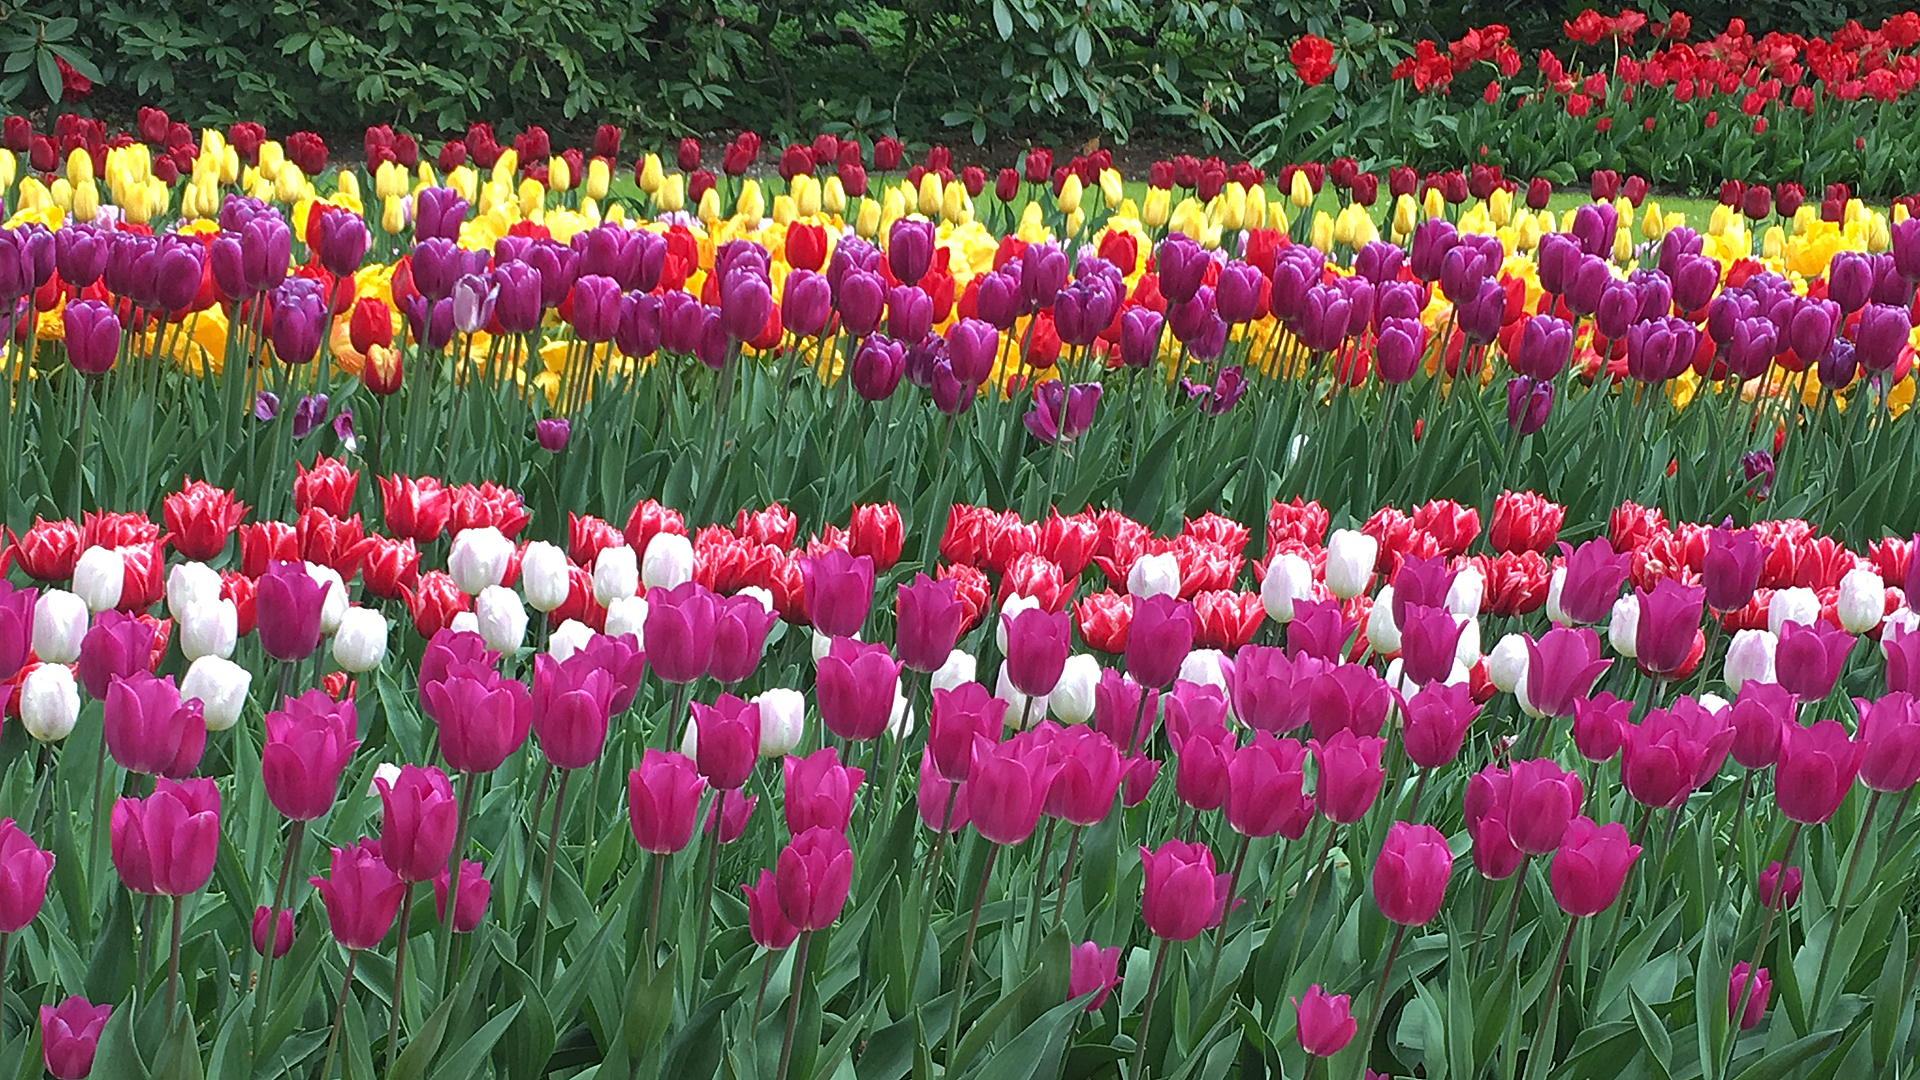
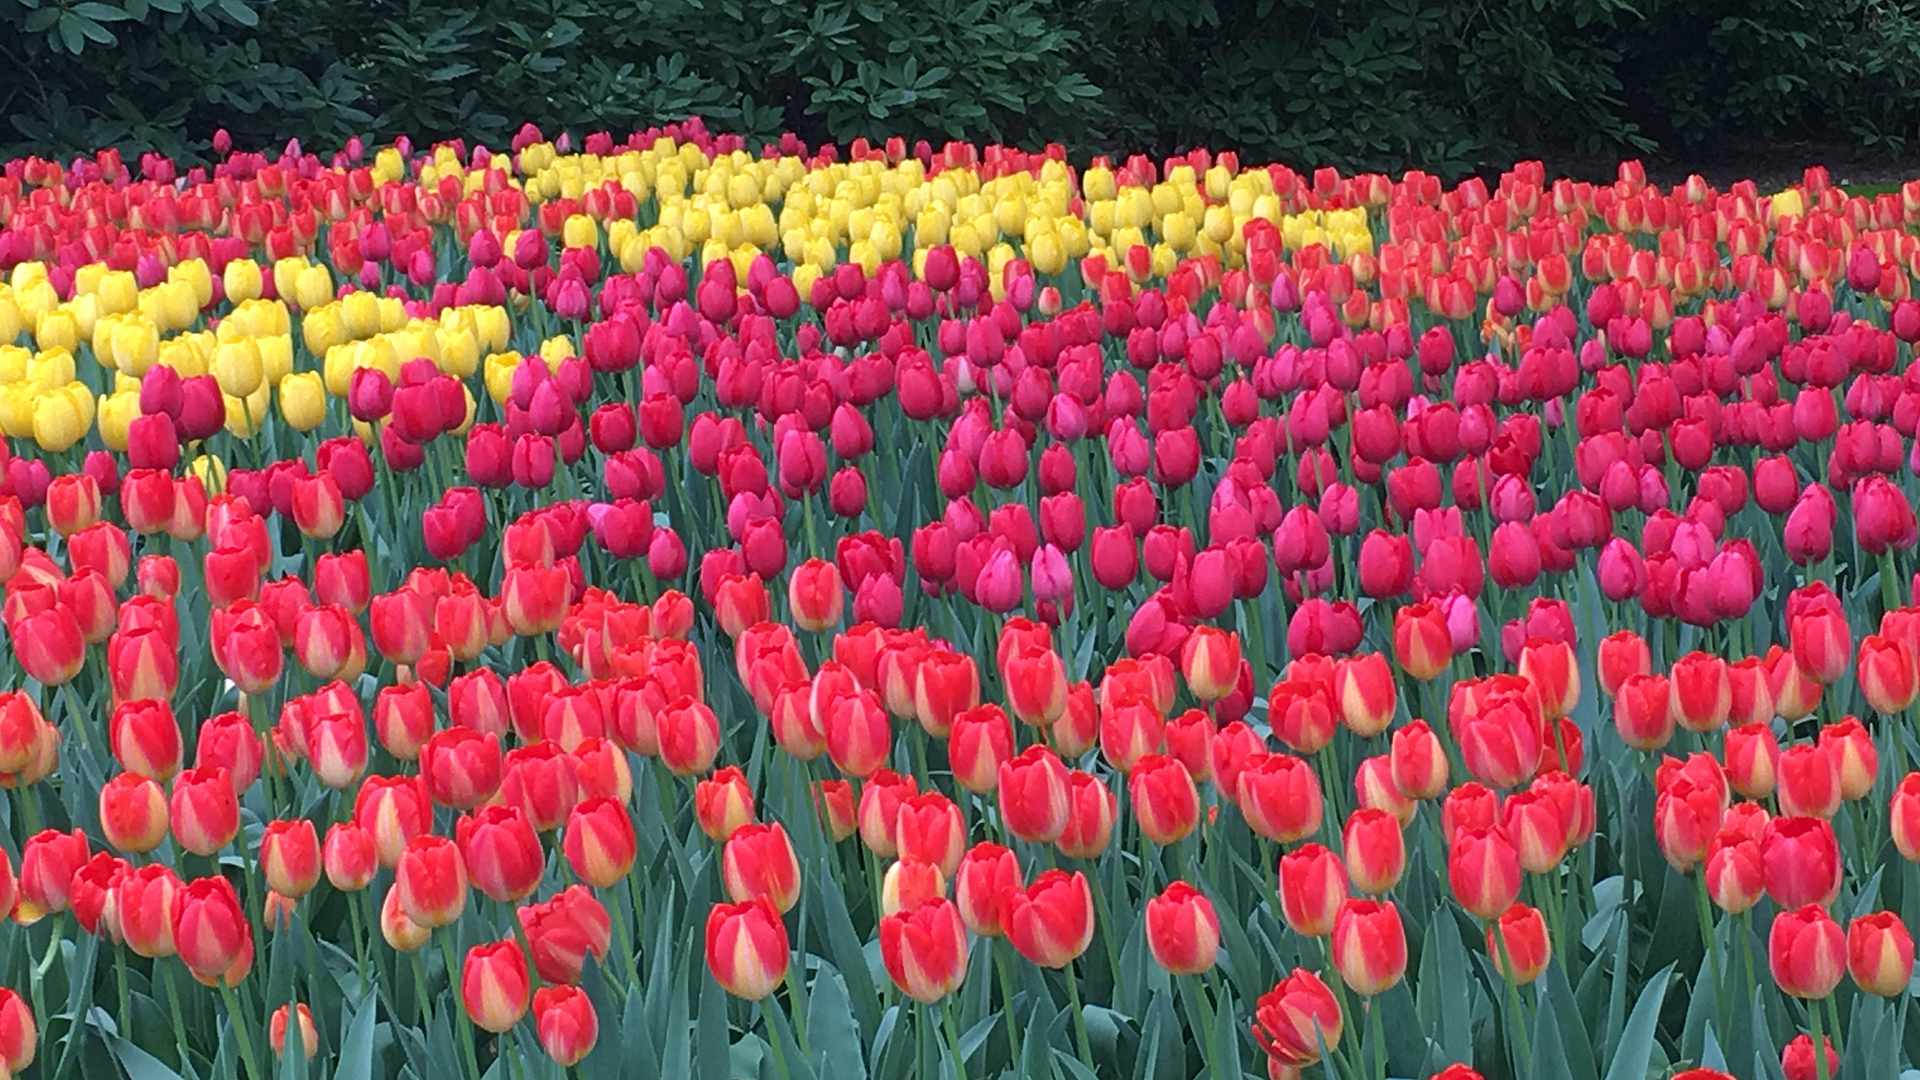
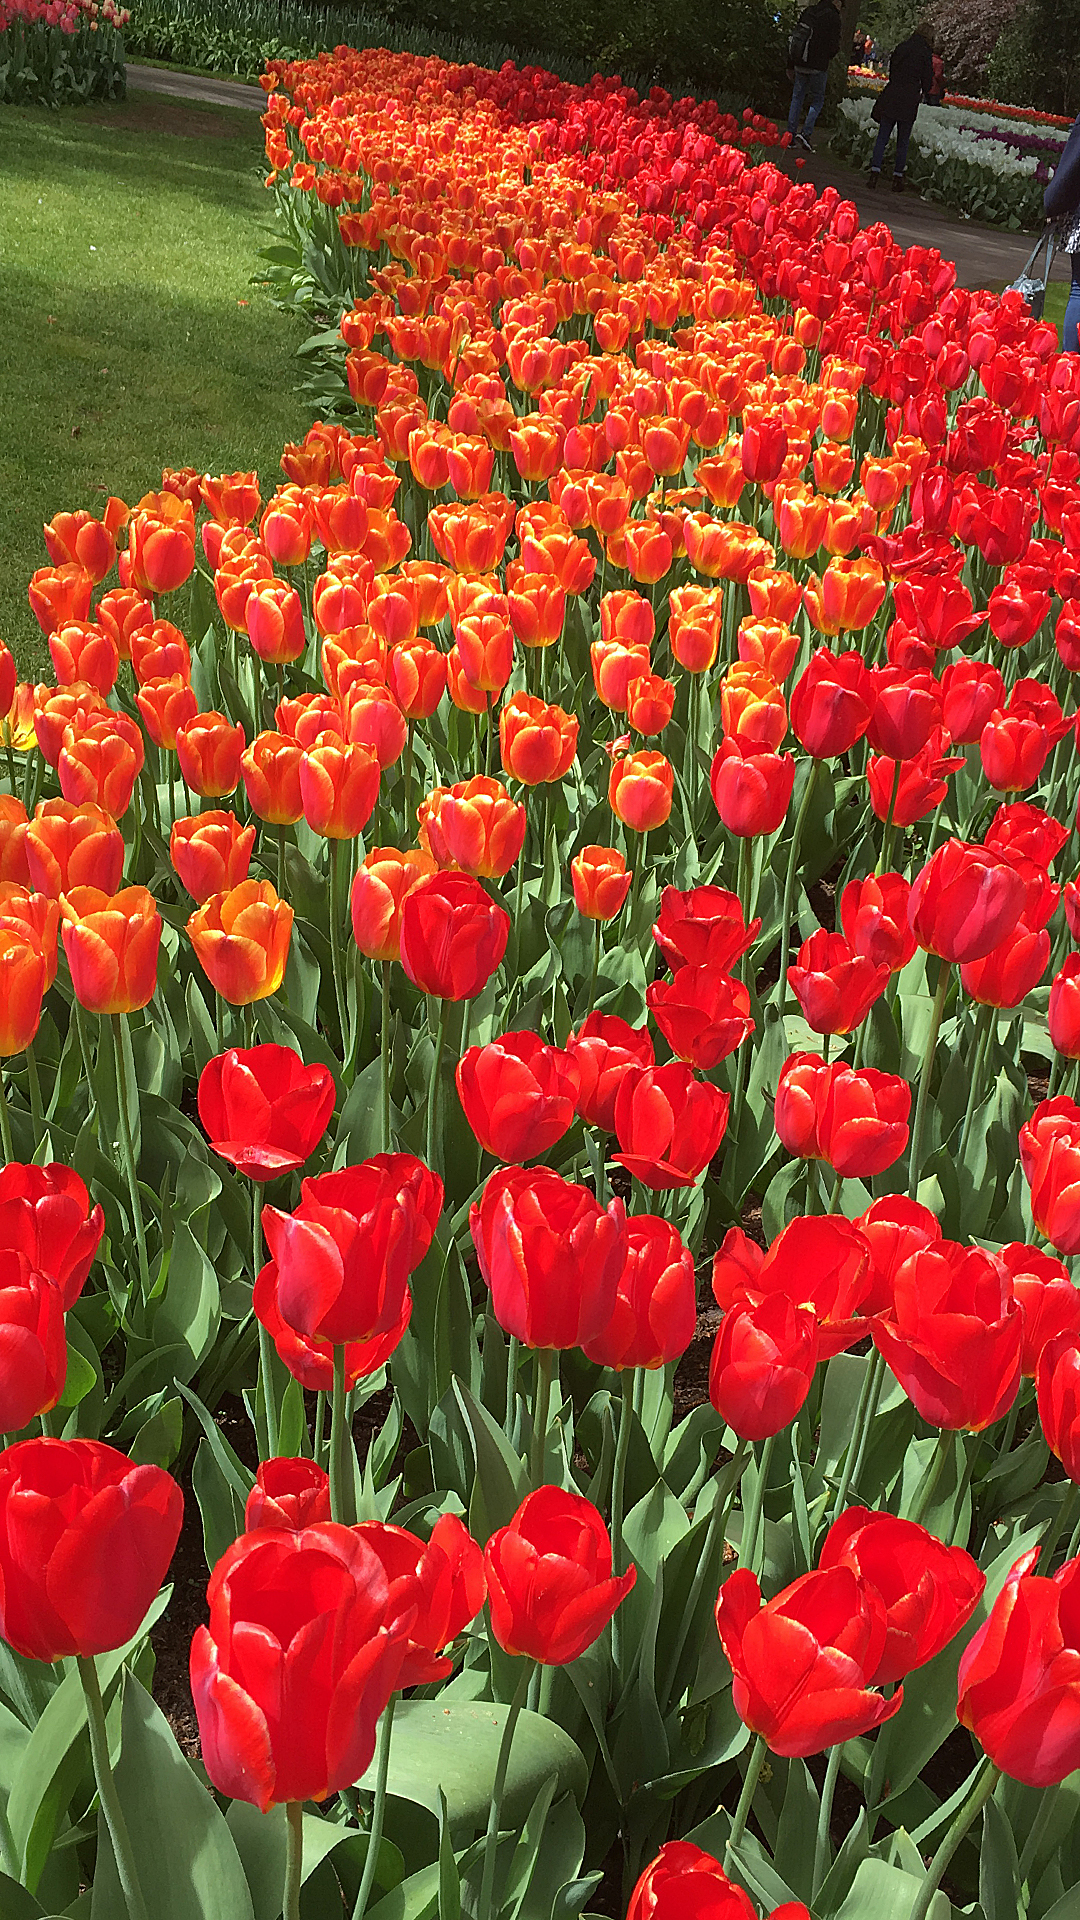
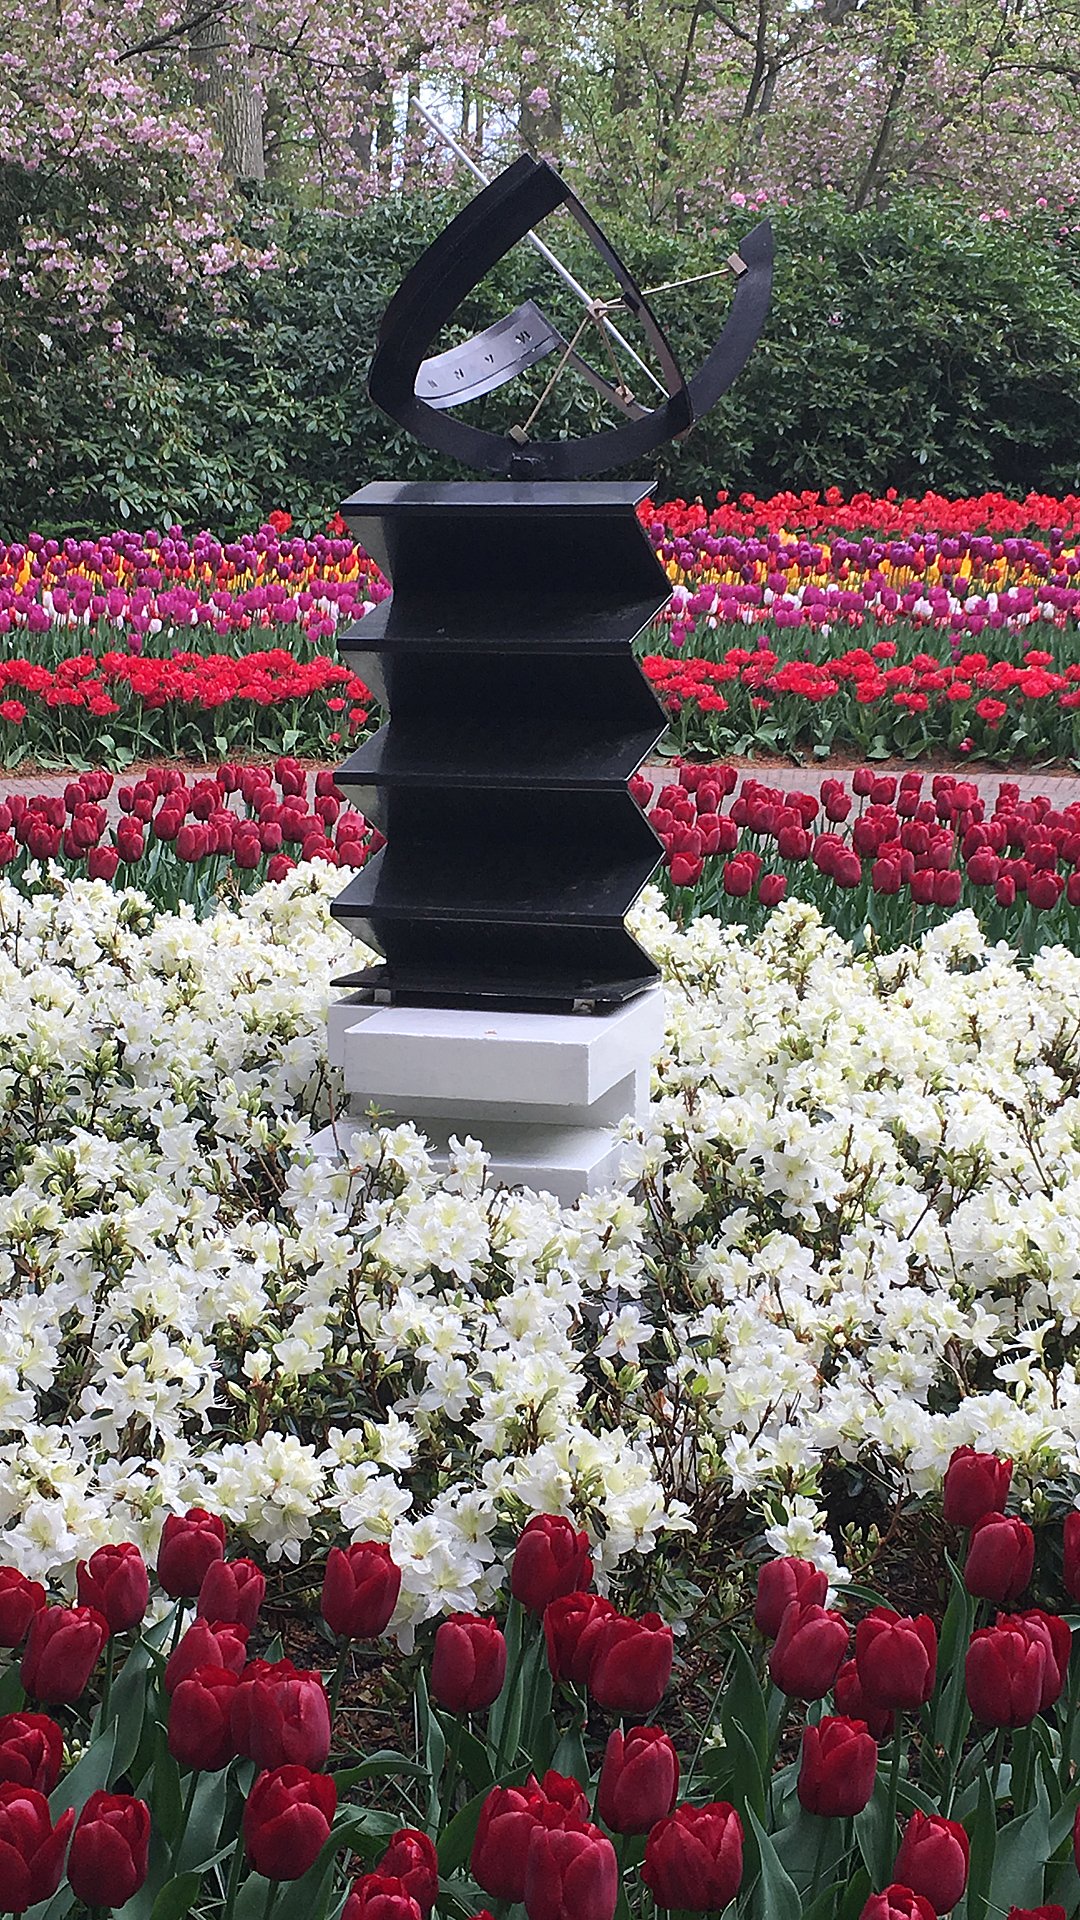
We then visted Keukenhof (Kitchen garden), also known as the Garden of Europe, is one of the world's largest flower gardens, situated in Lisse, South Holland, Netherlands. Approximately 7 million flower bulbs are planted annually in the park, which covers an area of 79 acres.
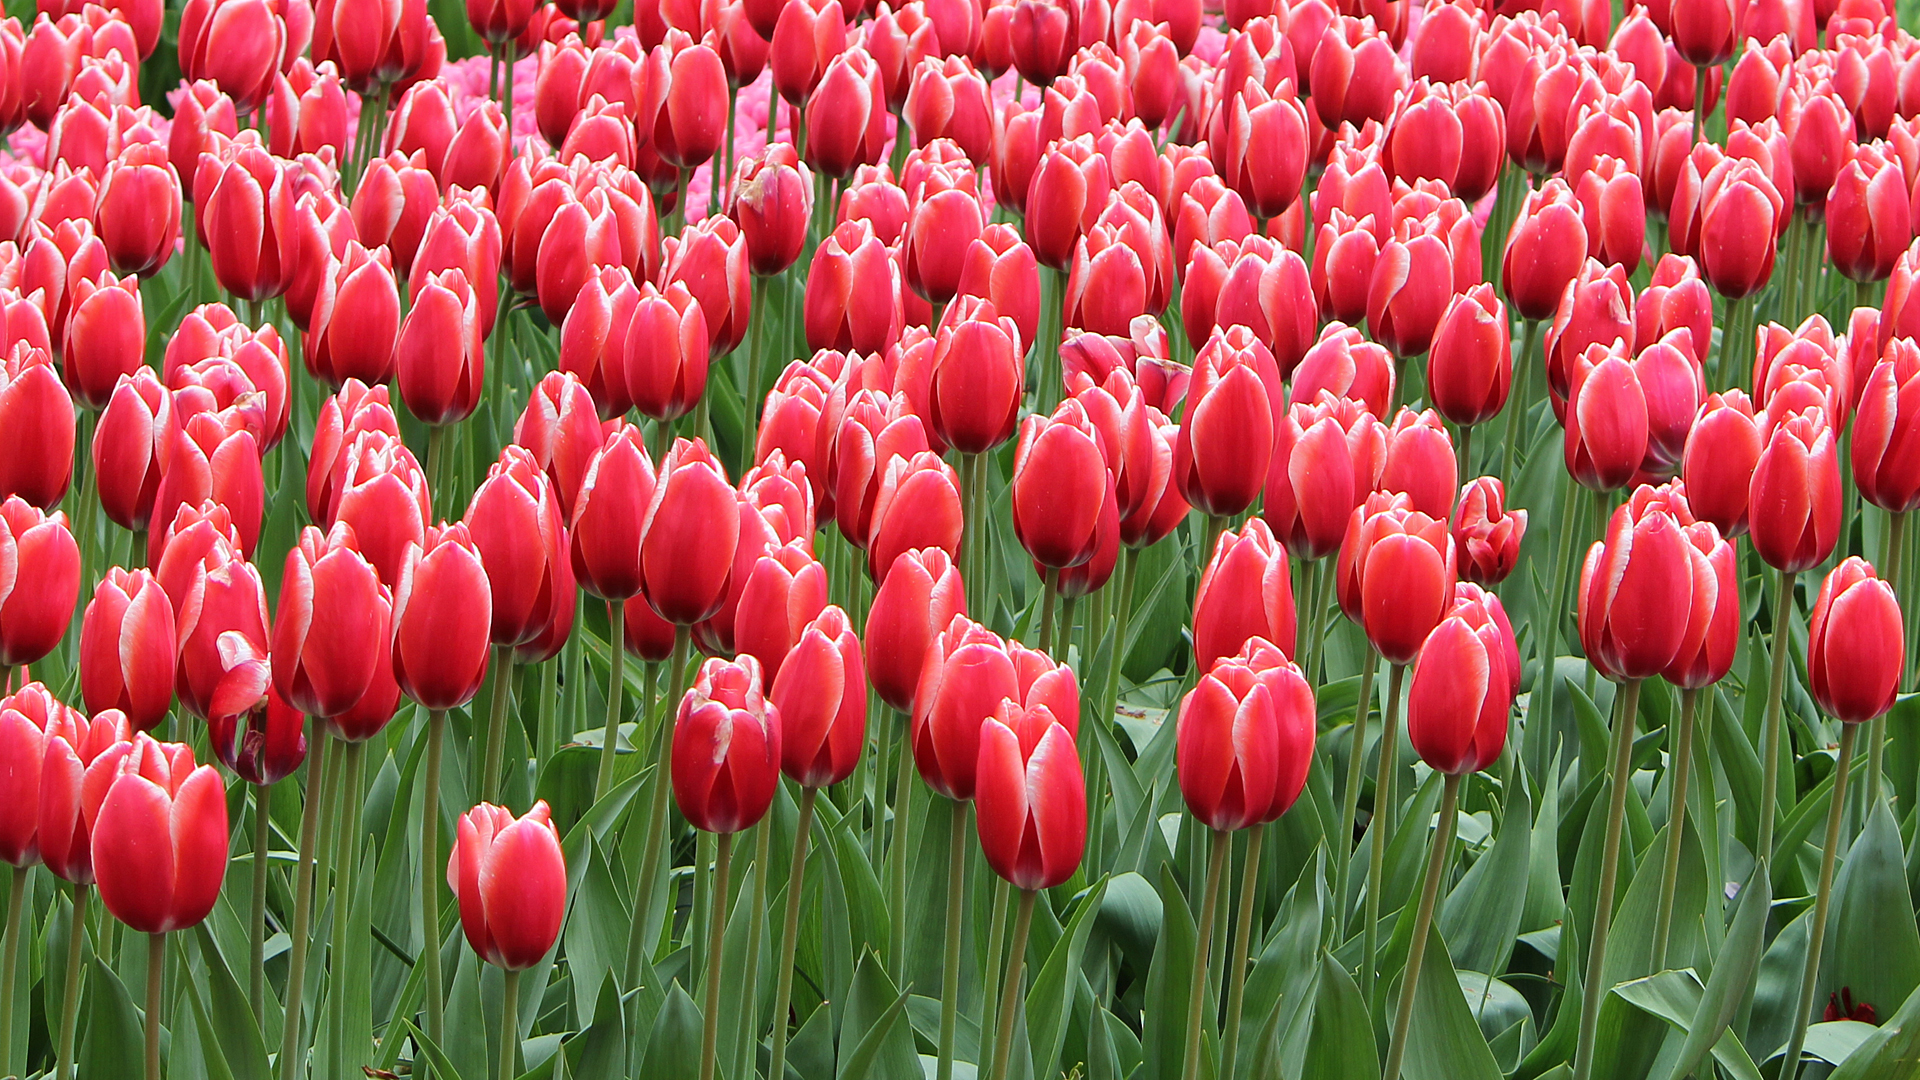
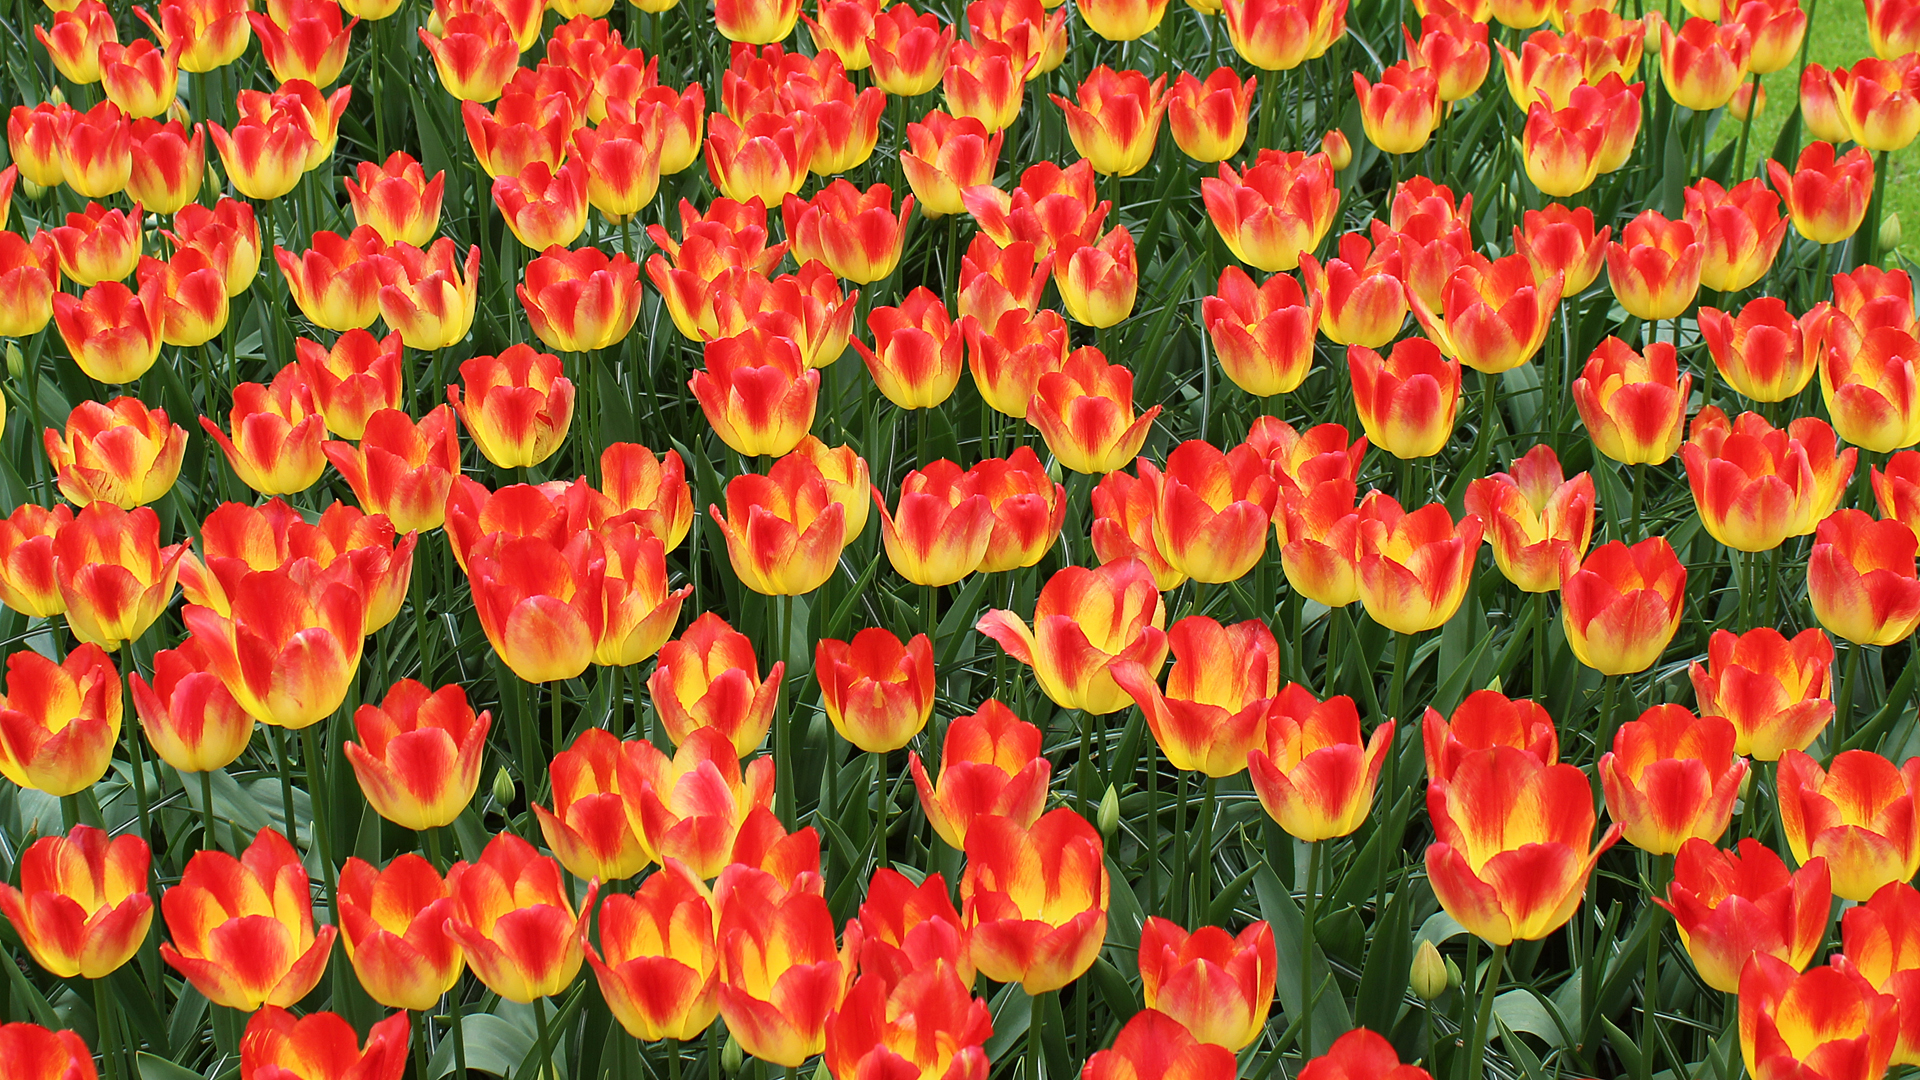
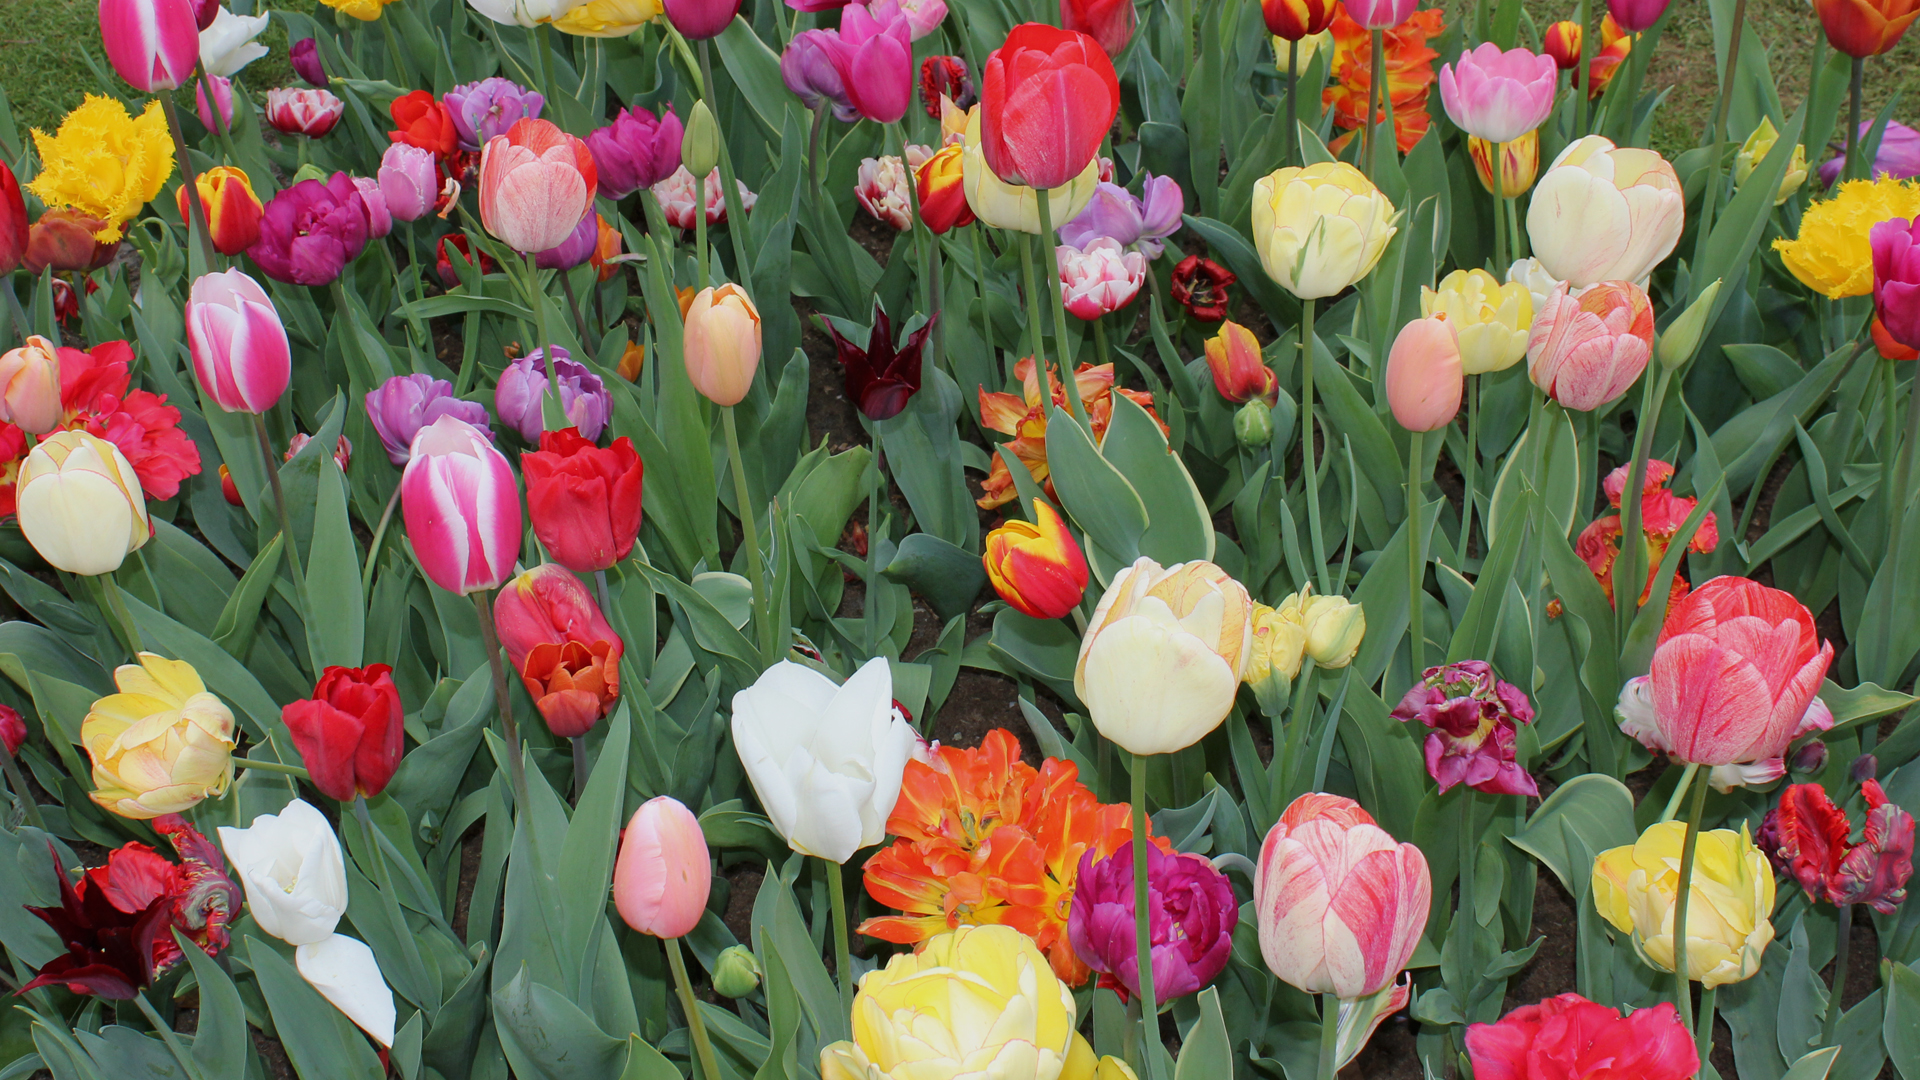

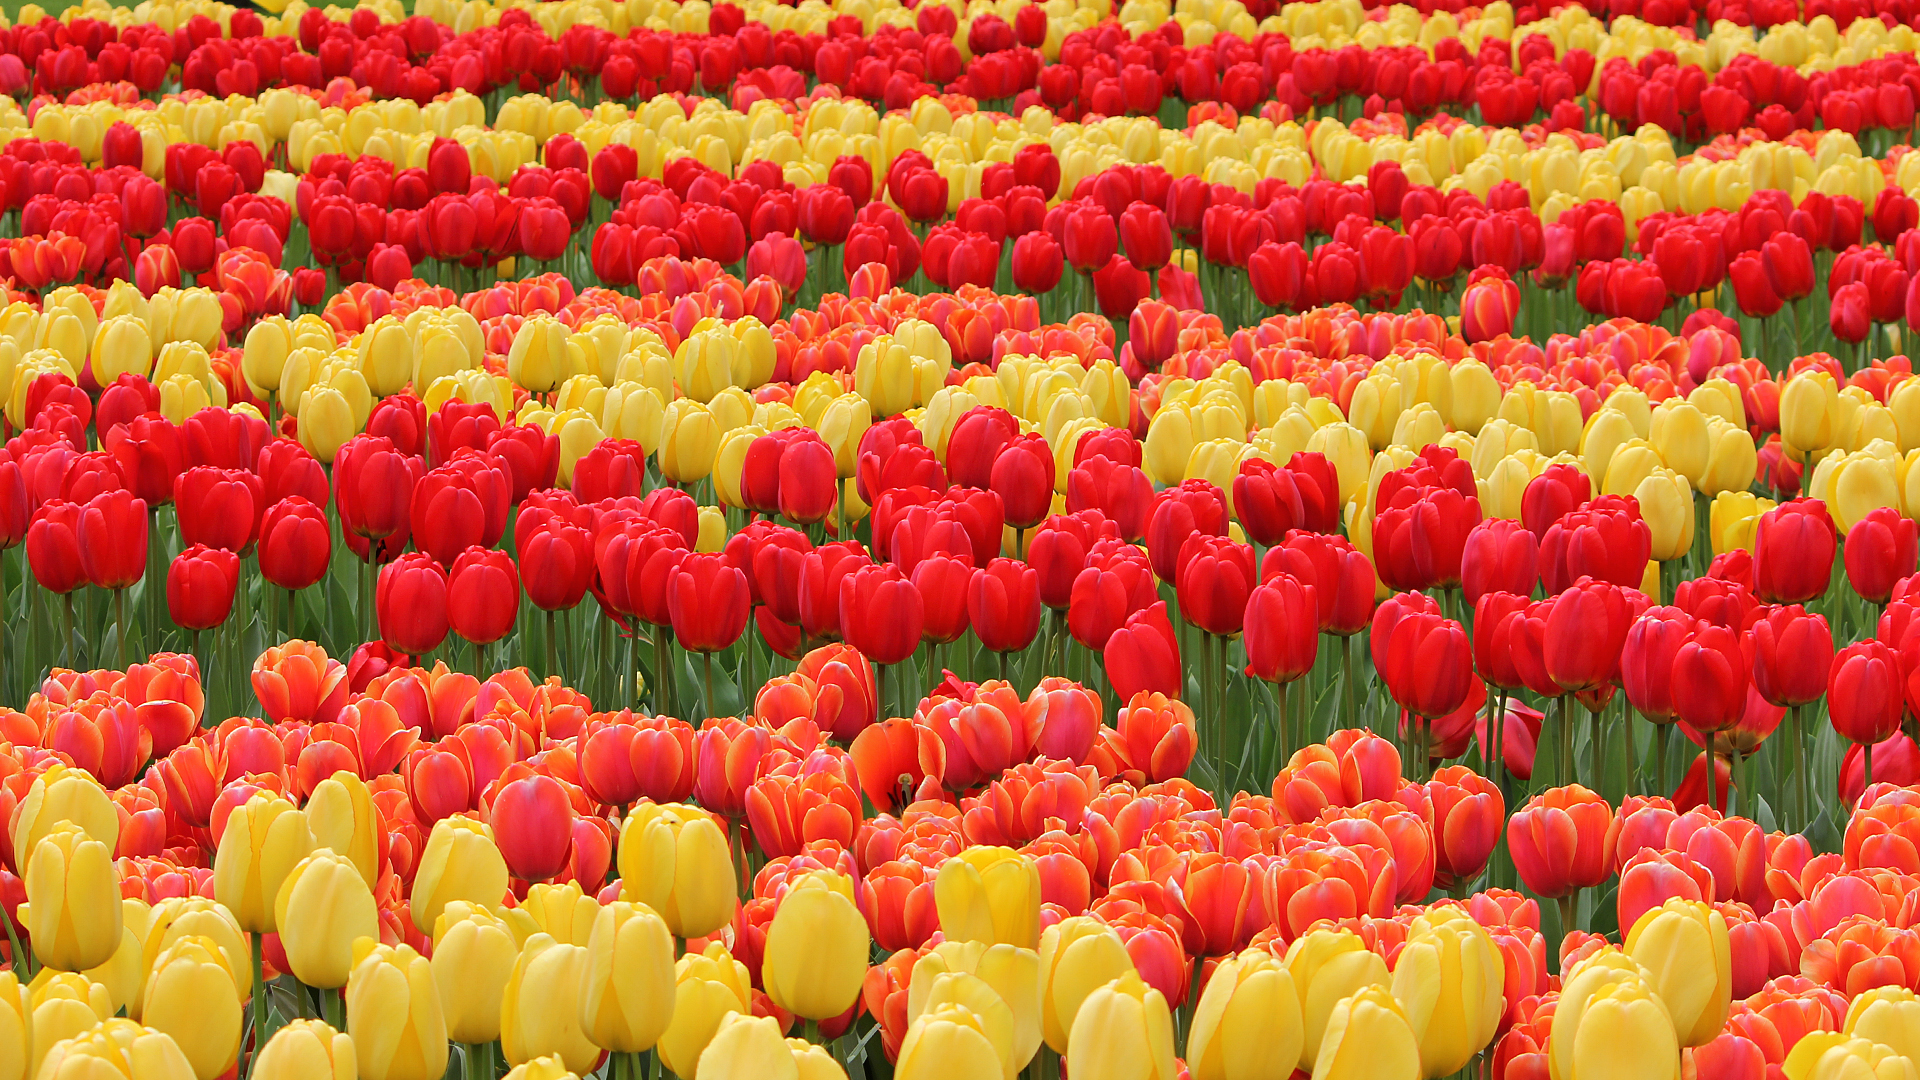

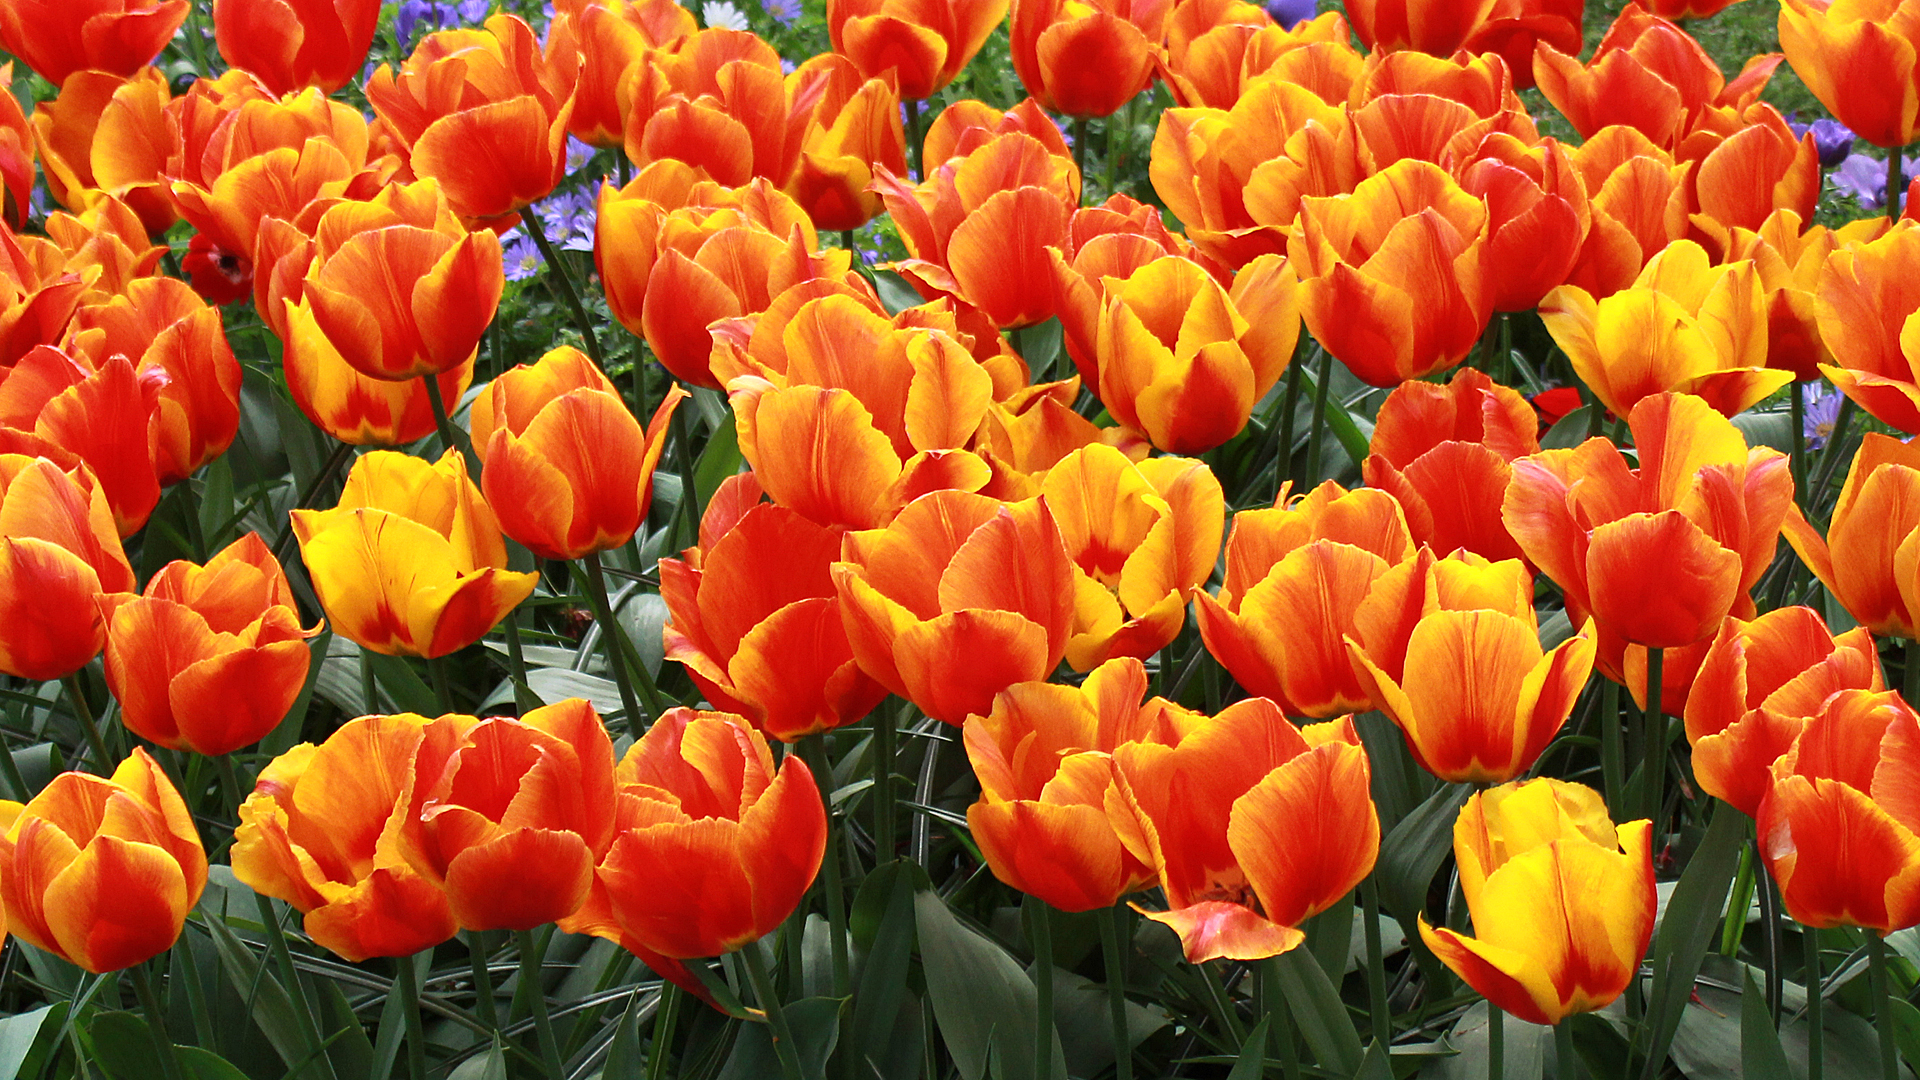
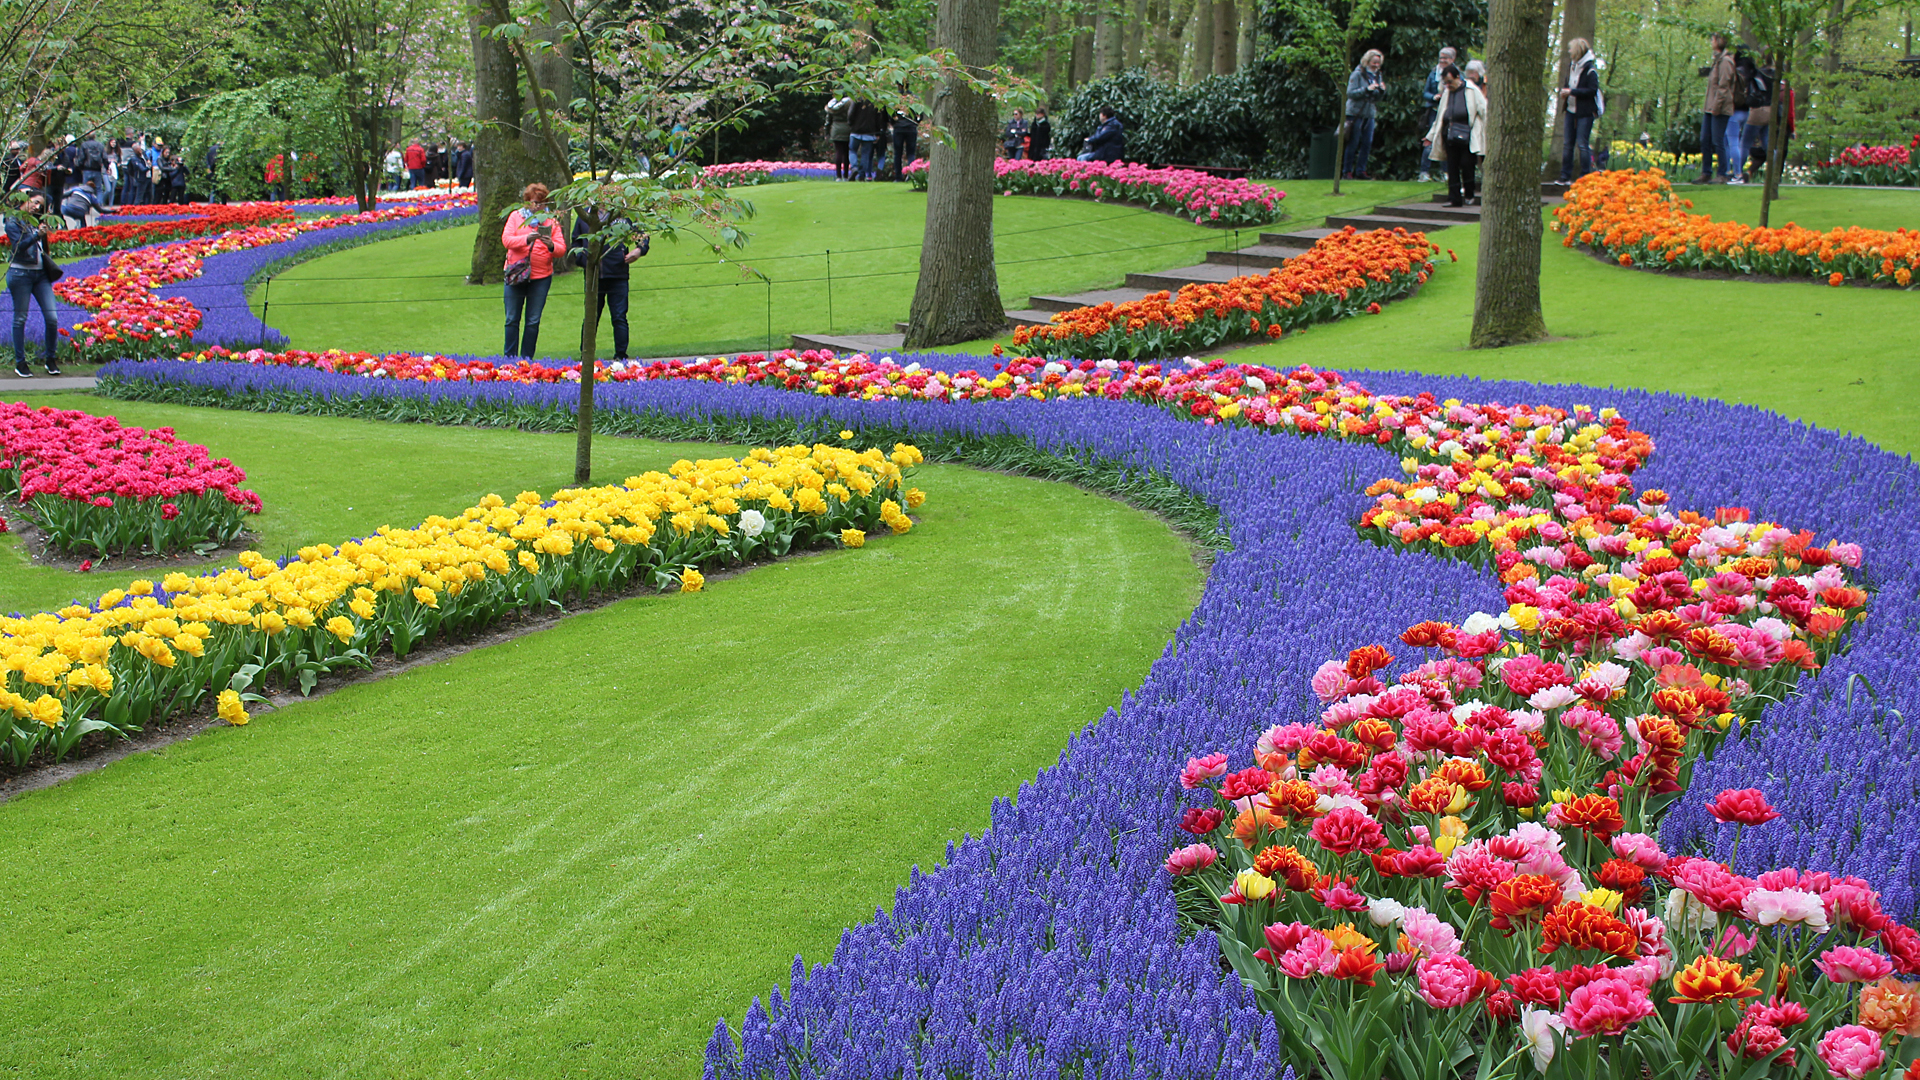
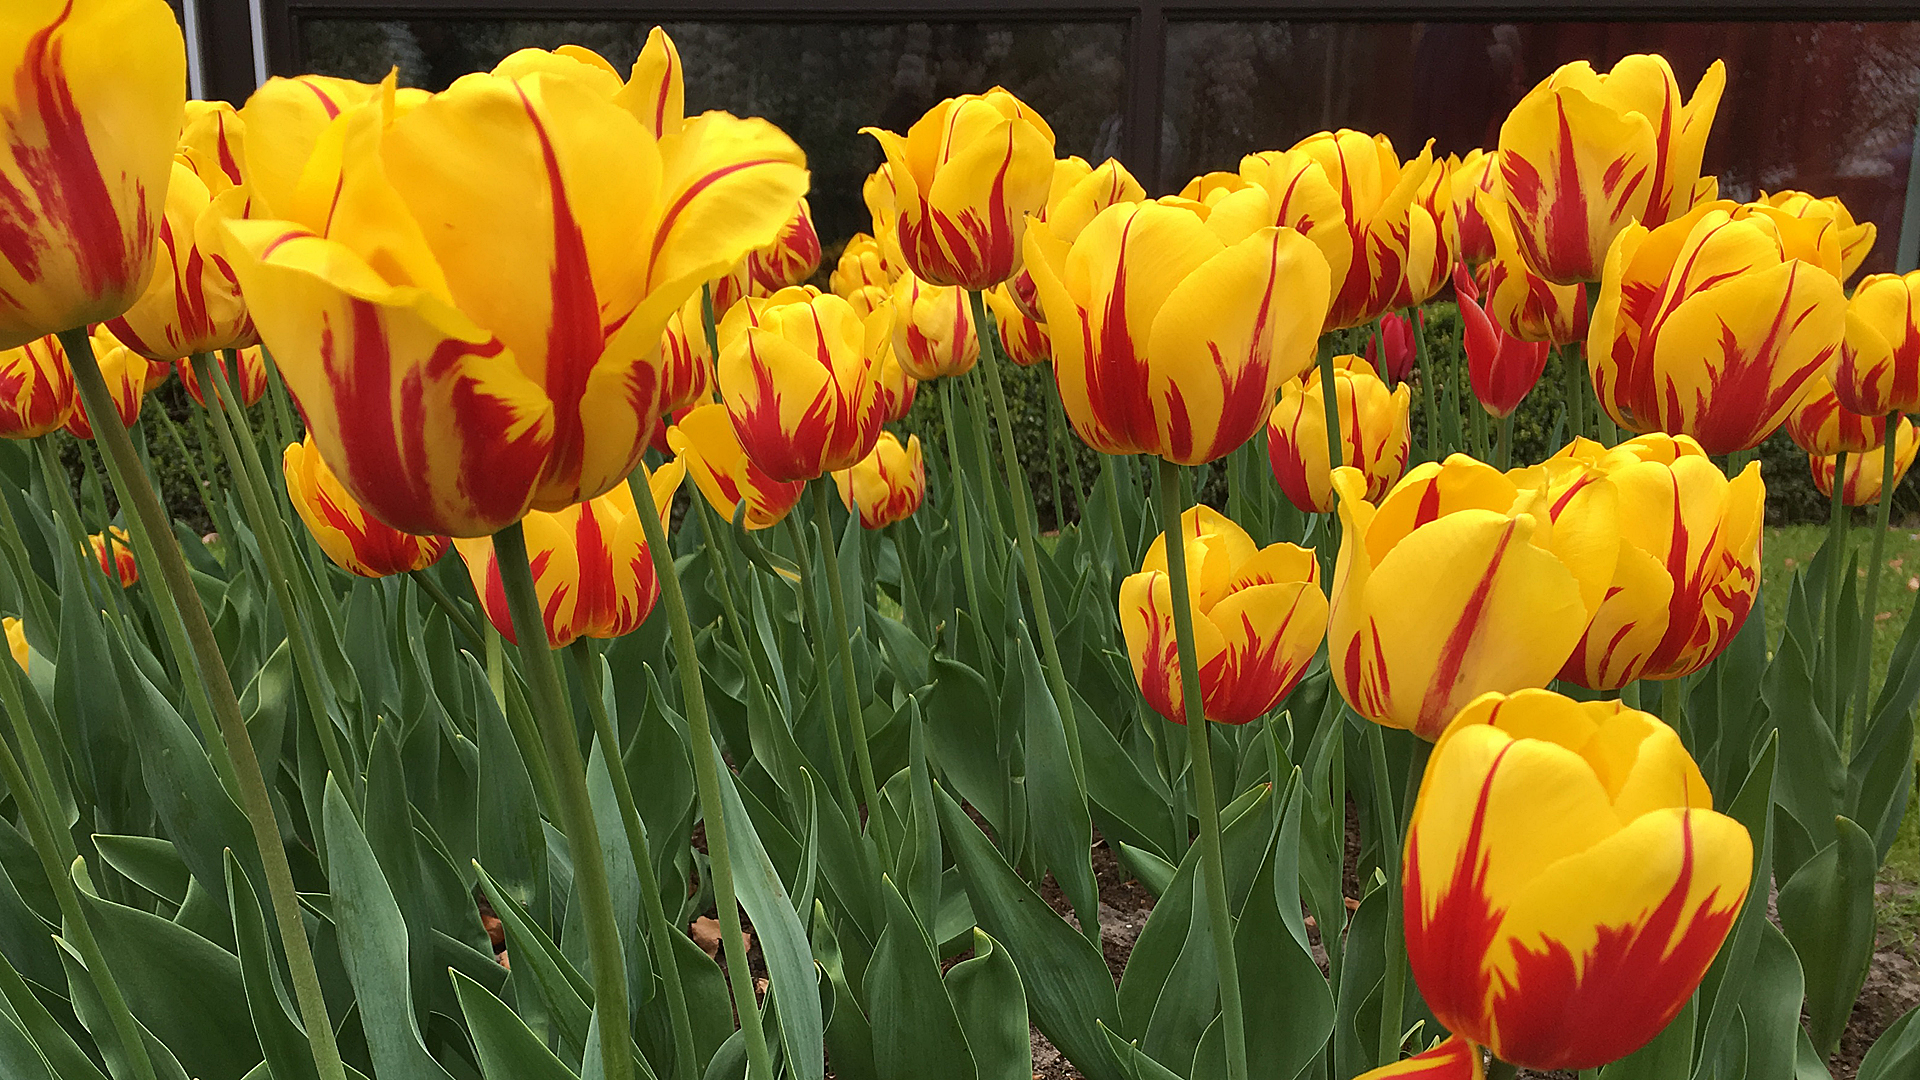
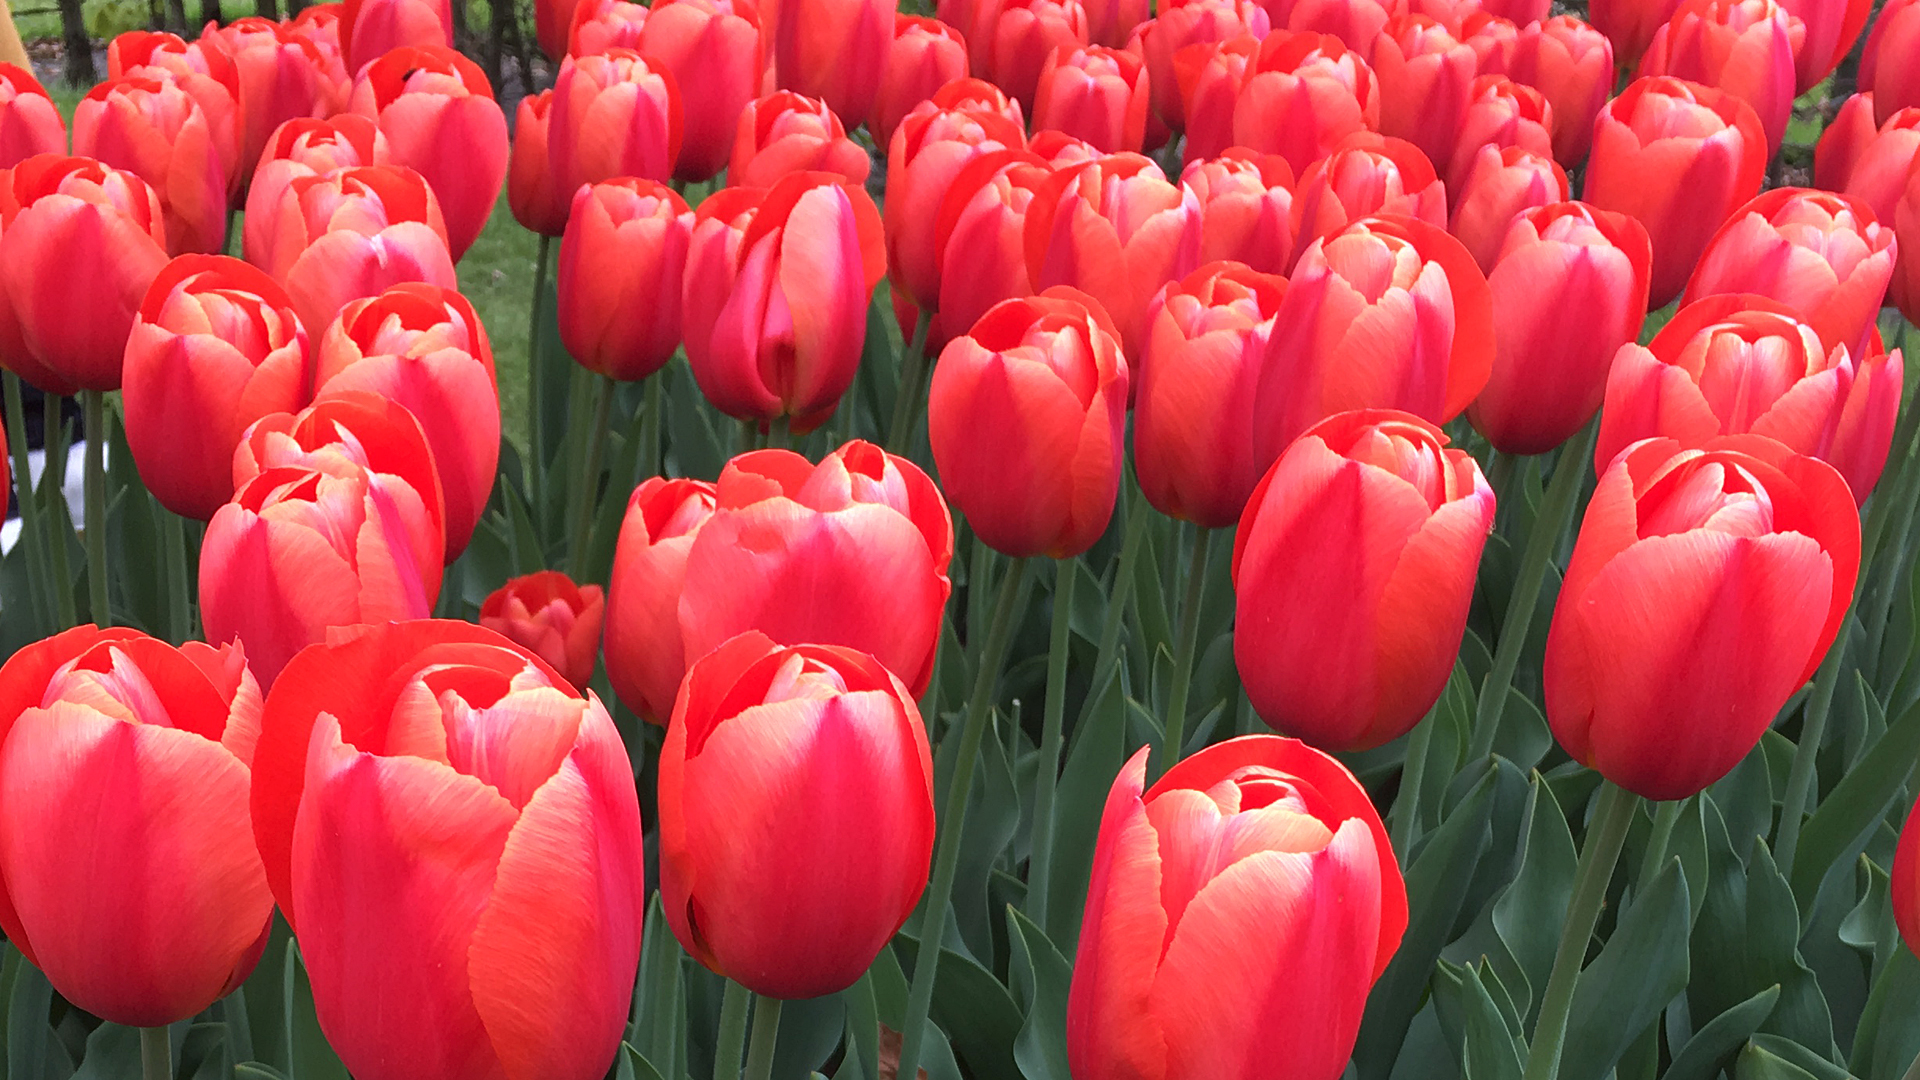
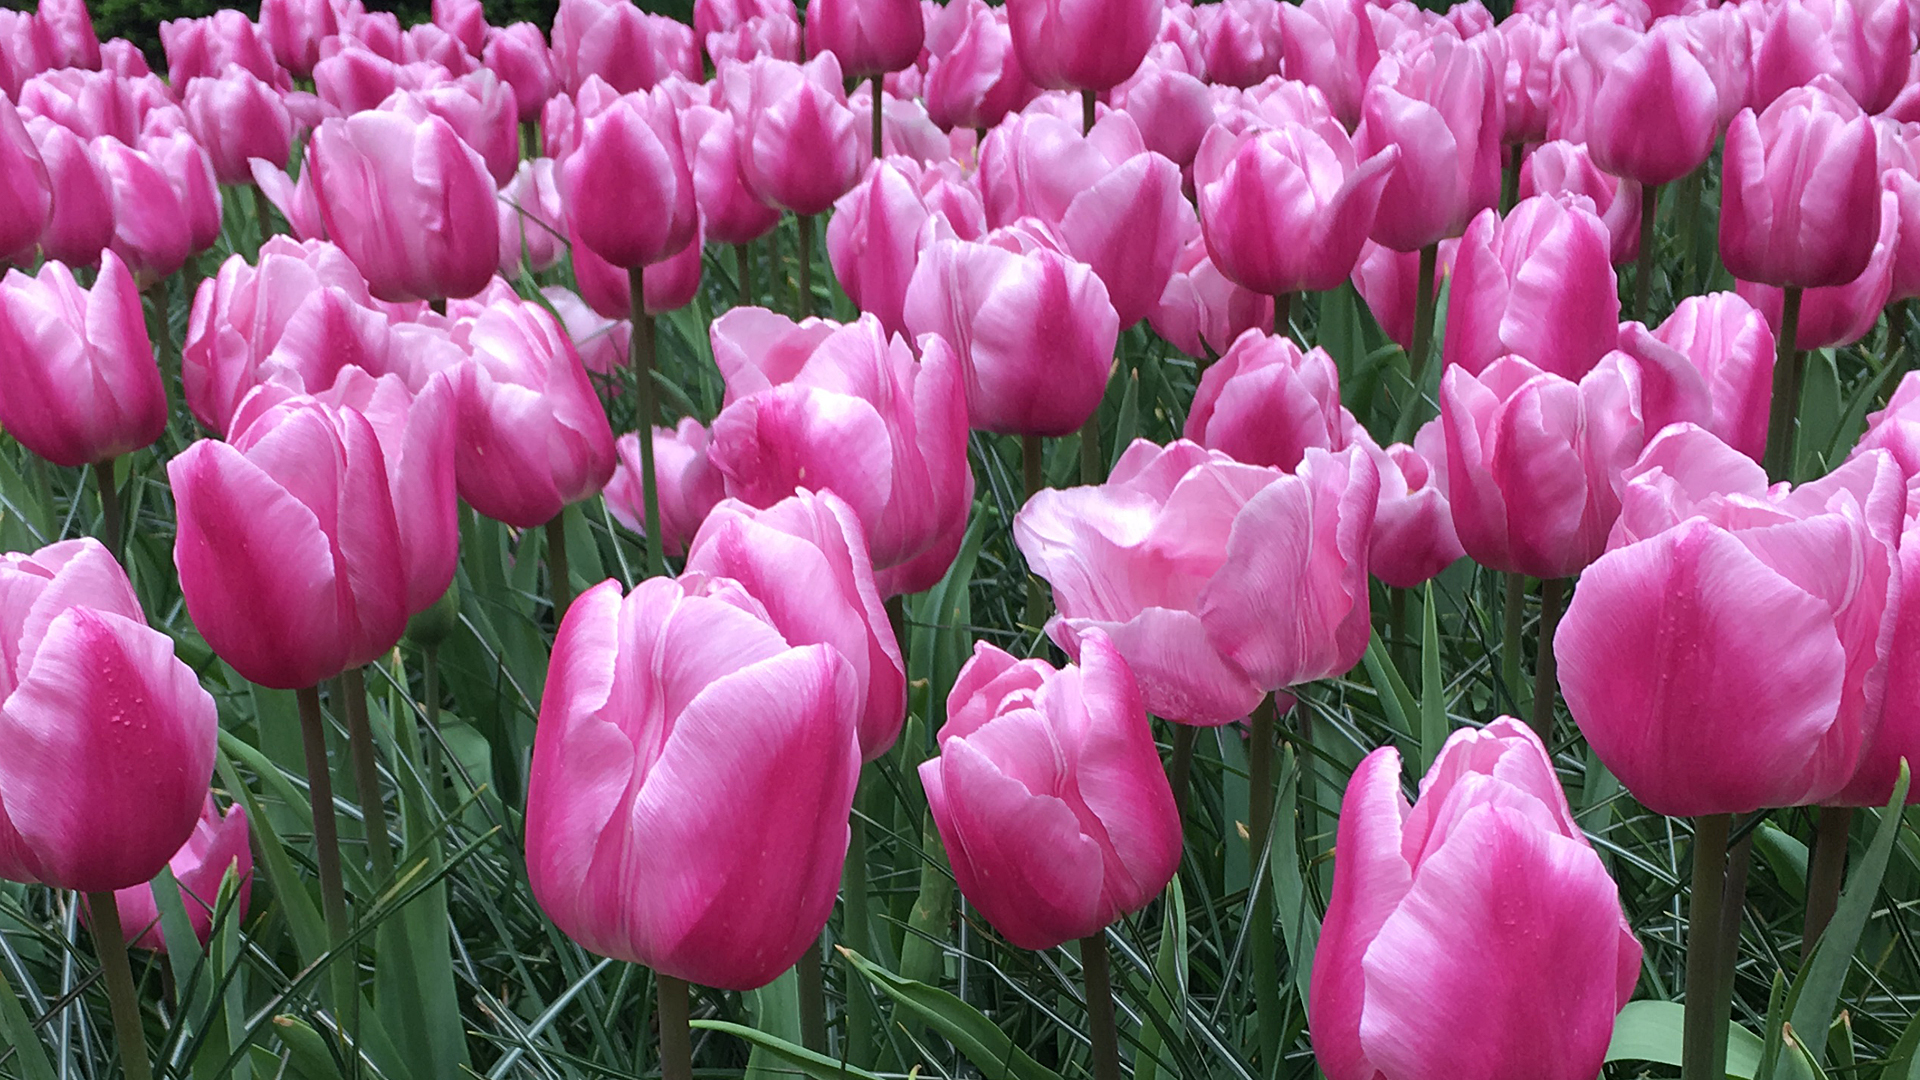
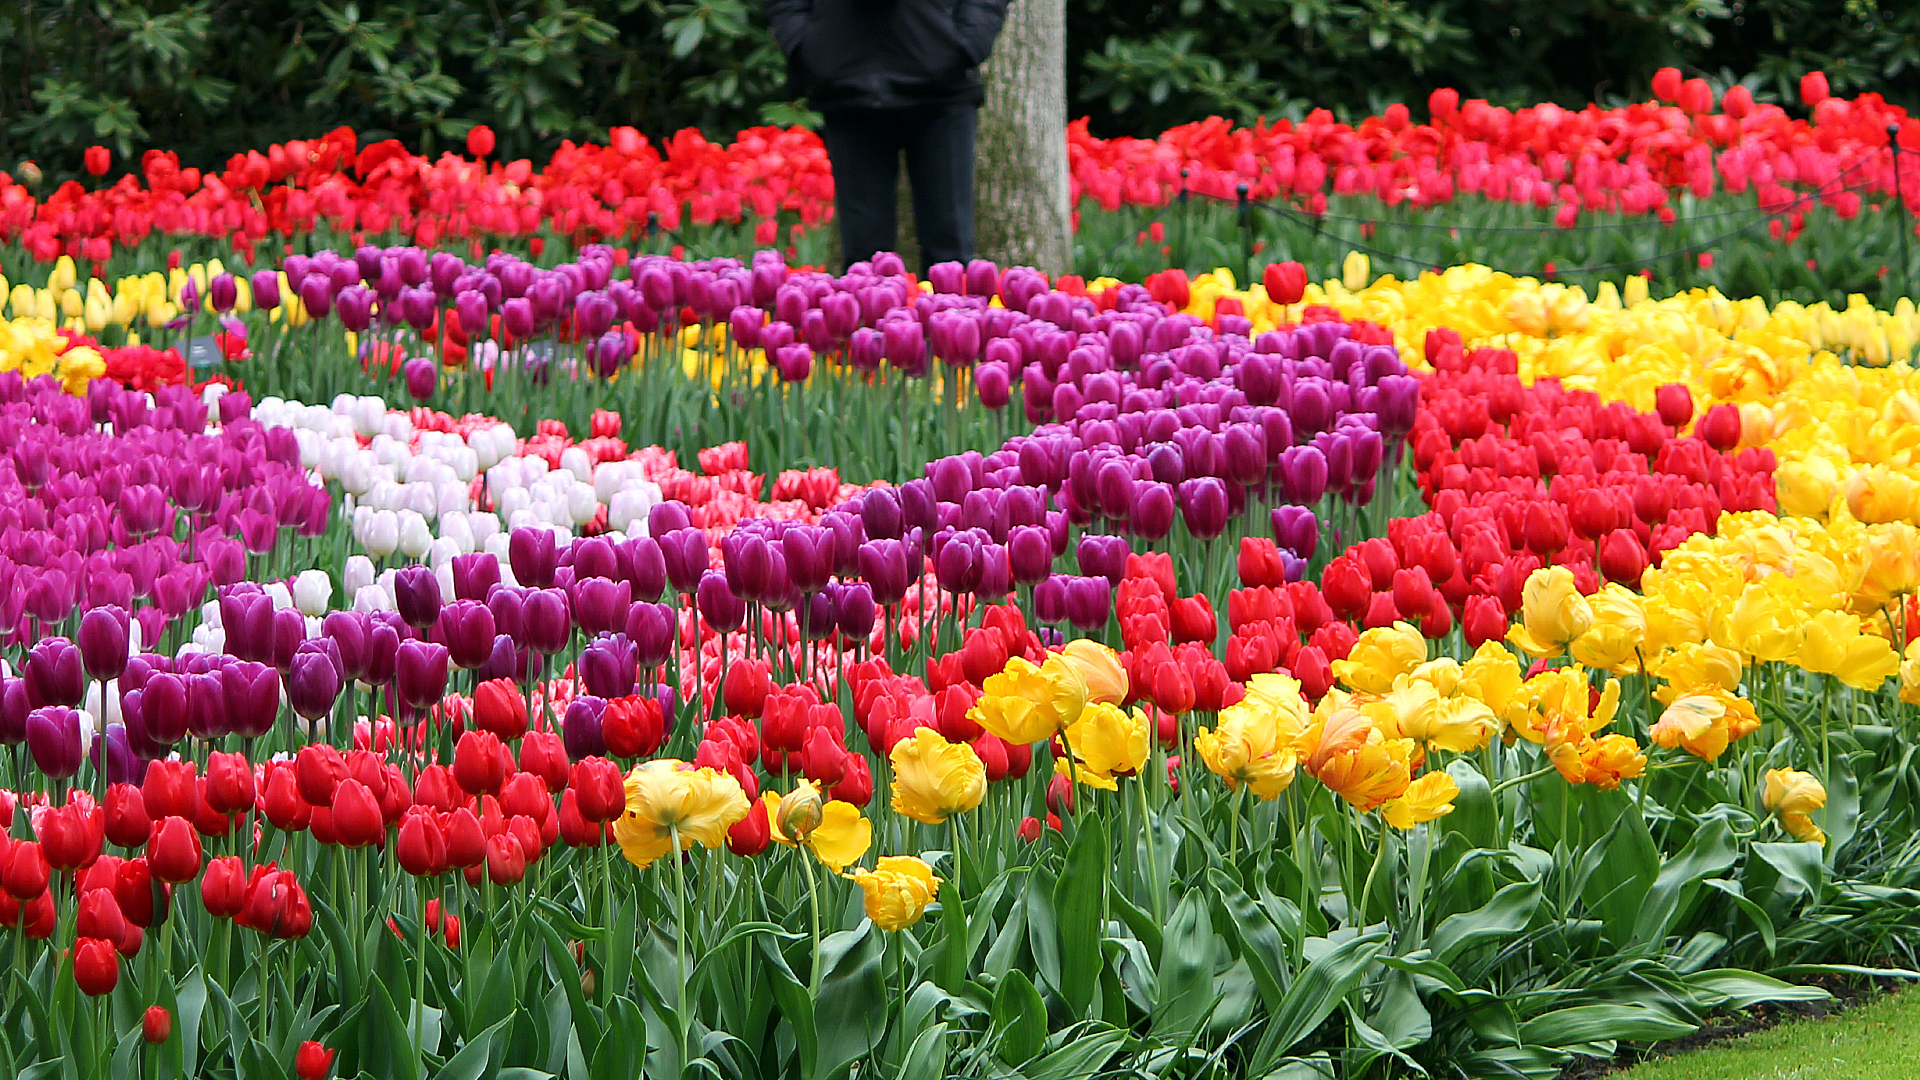
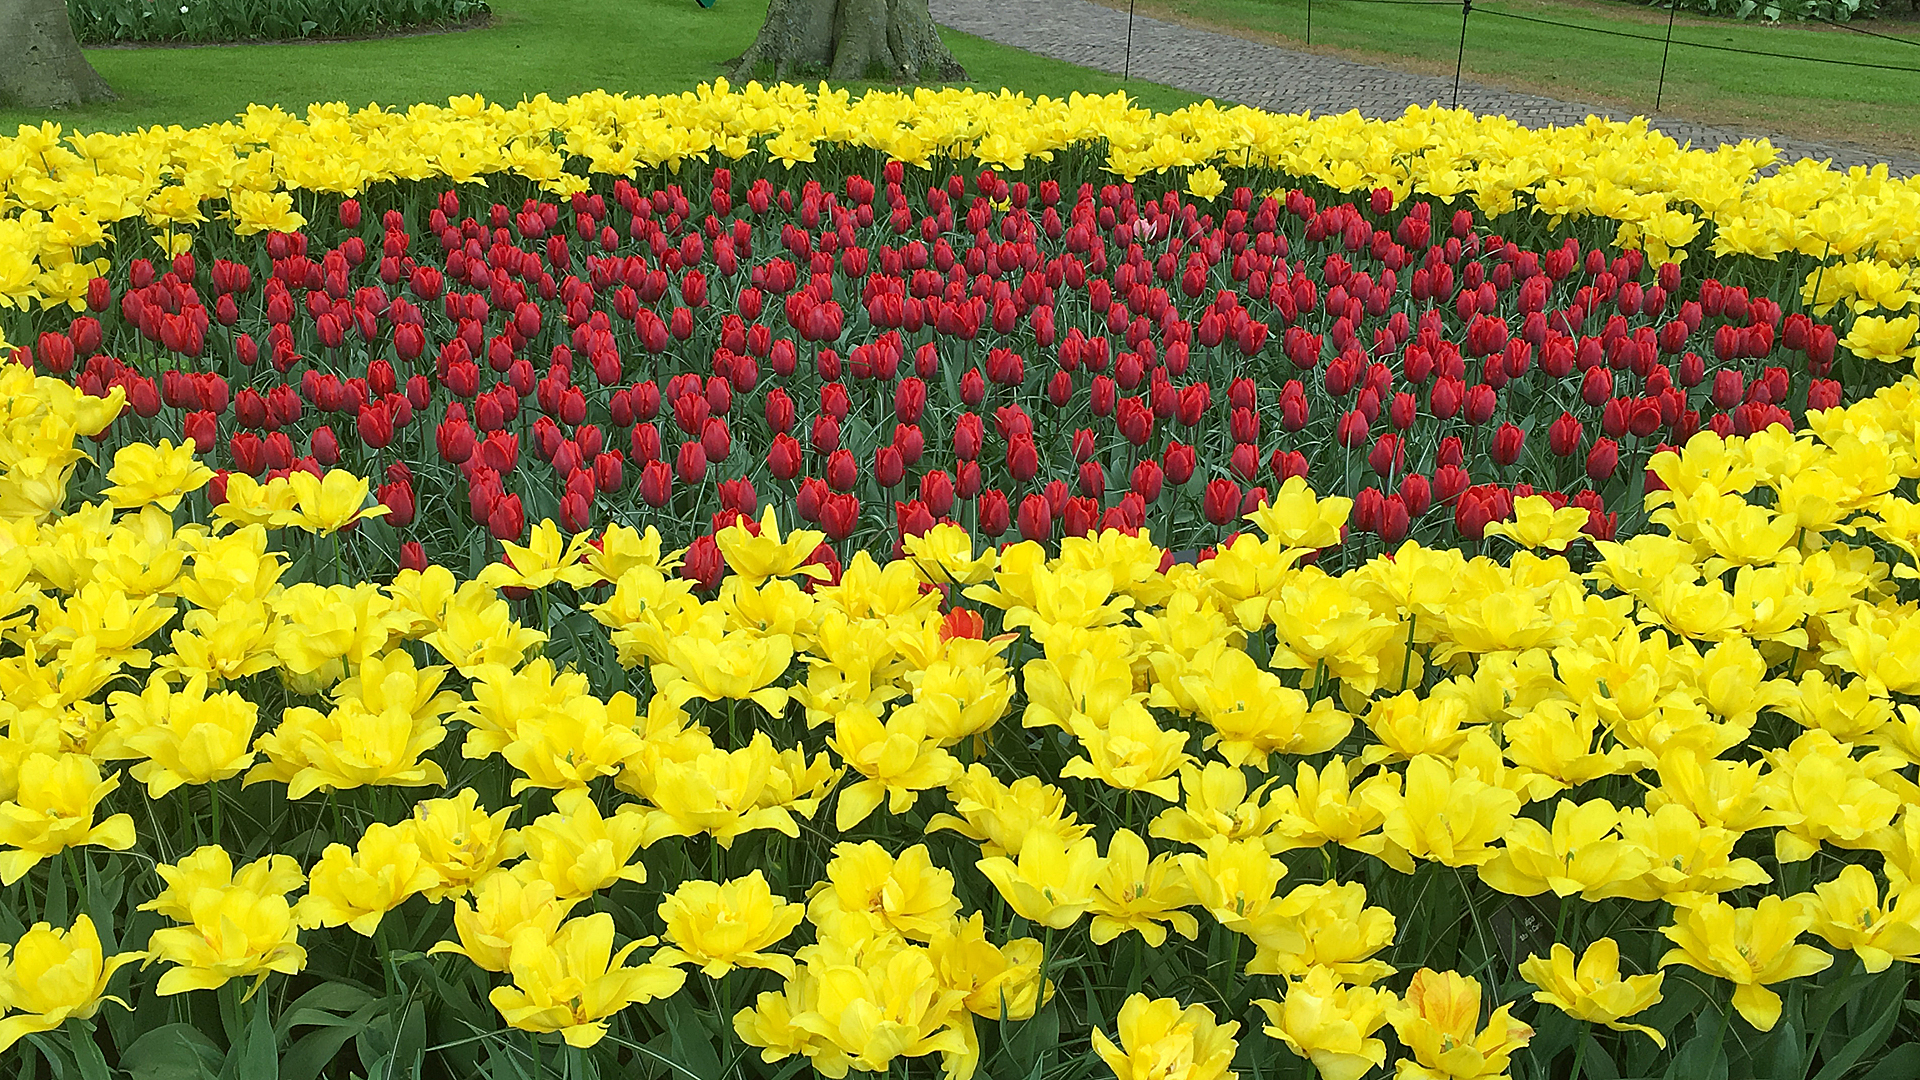
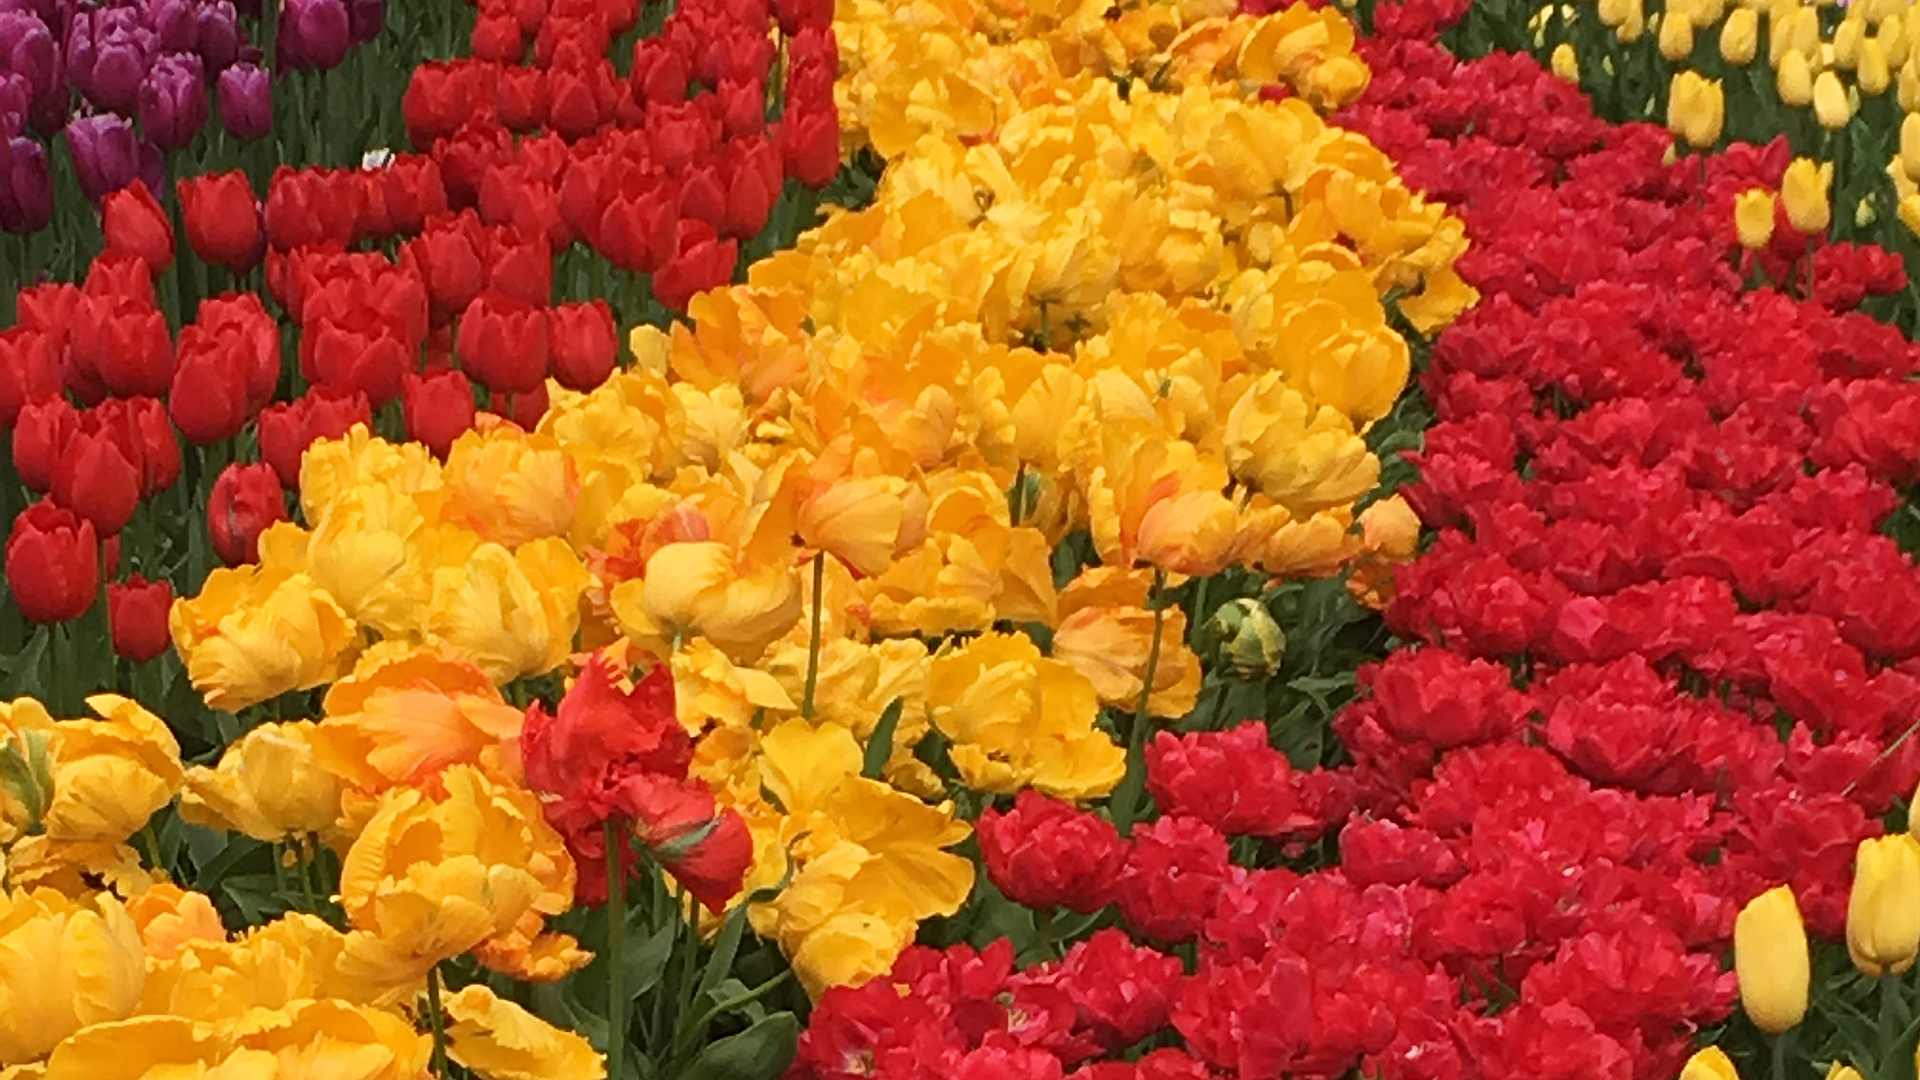
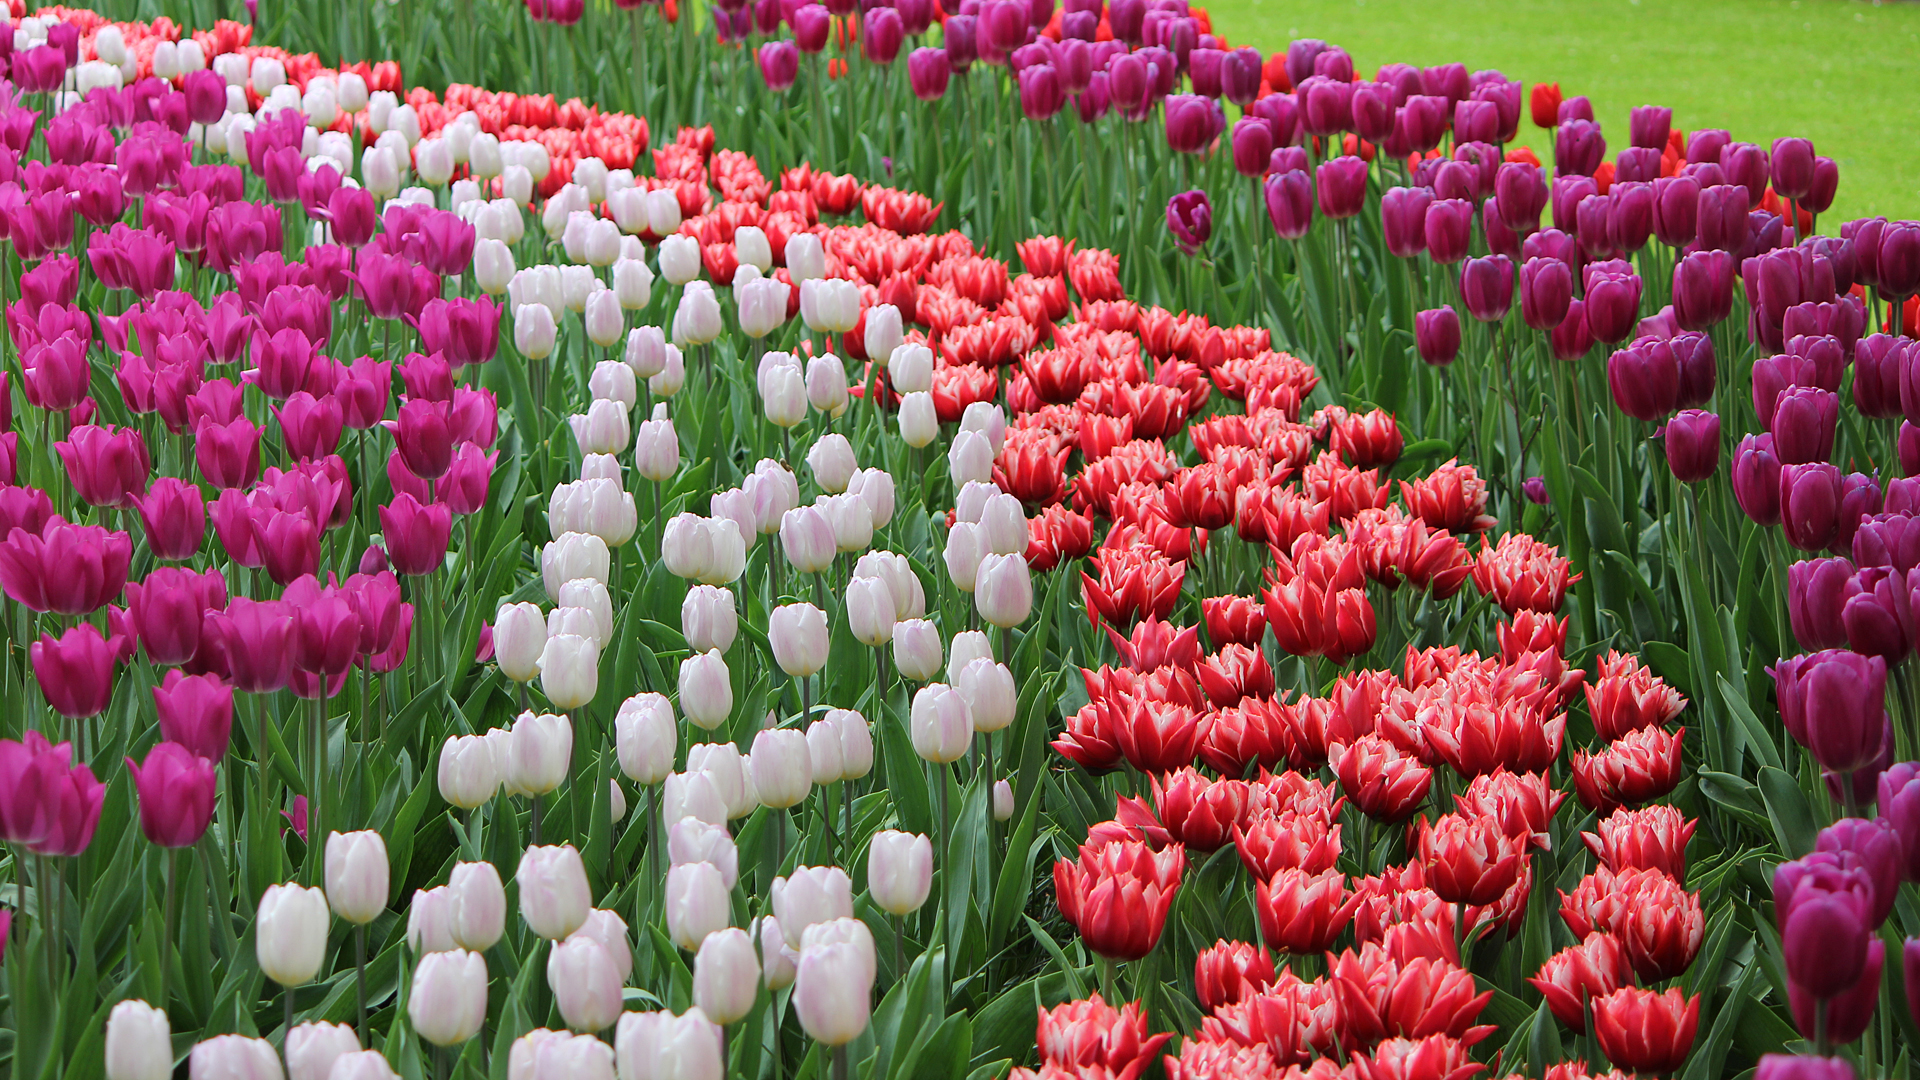


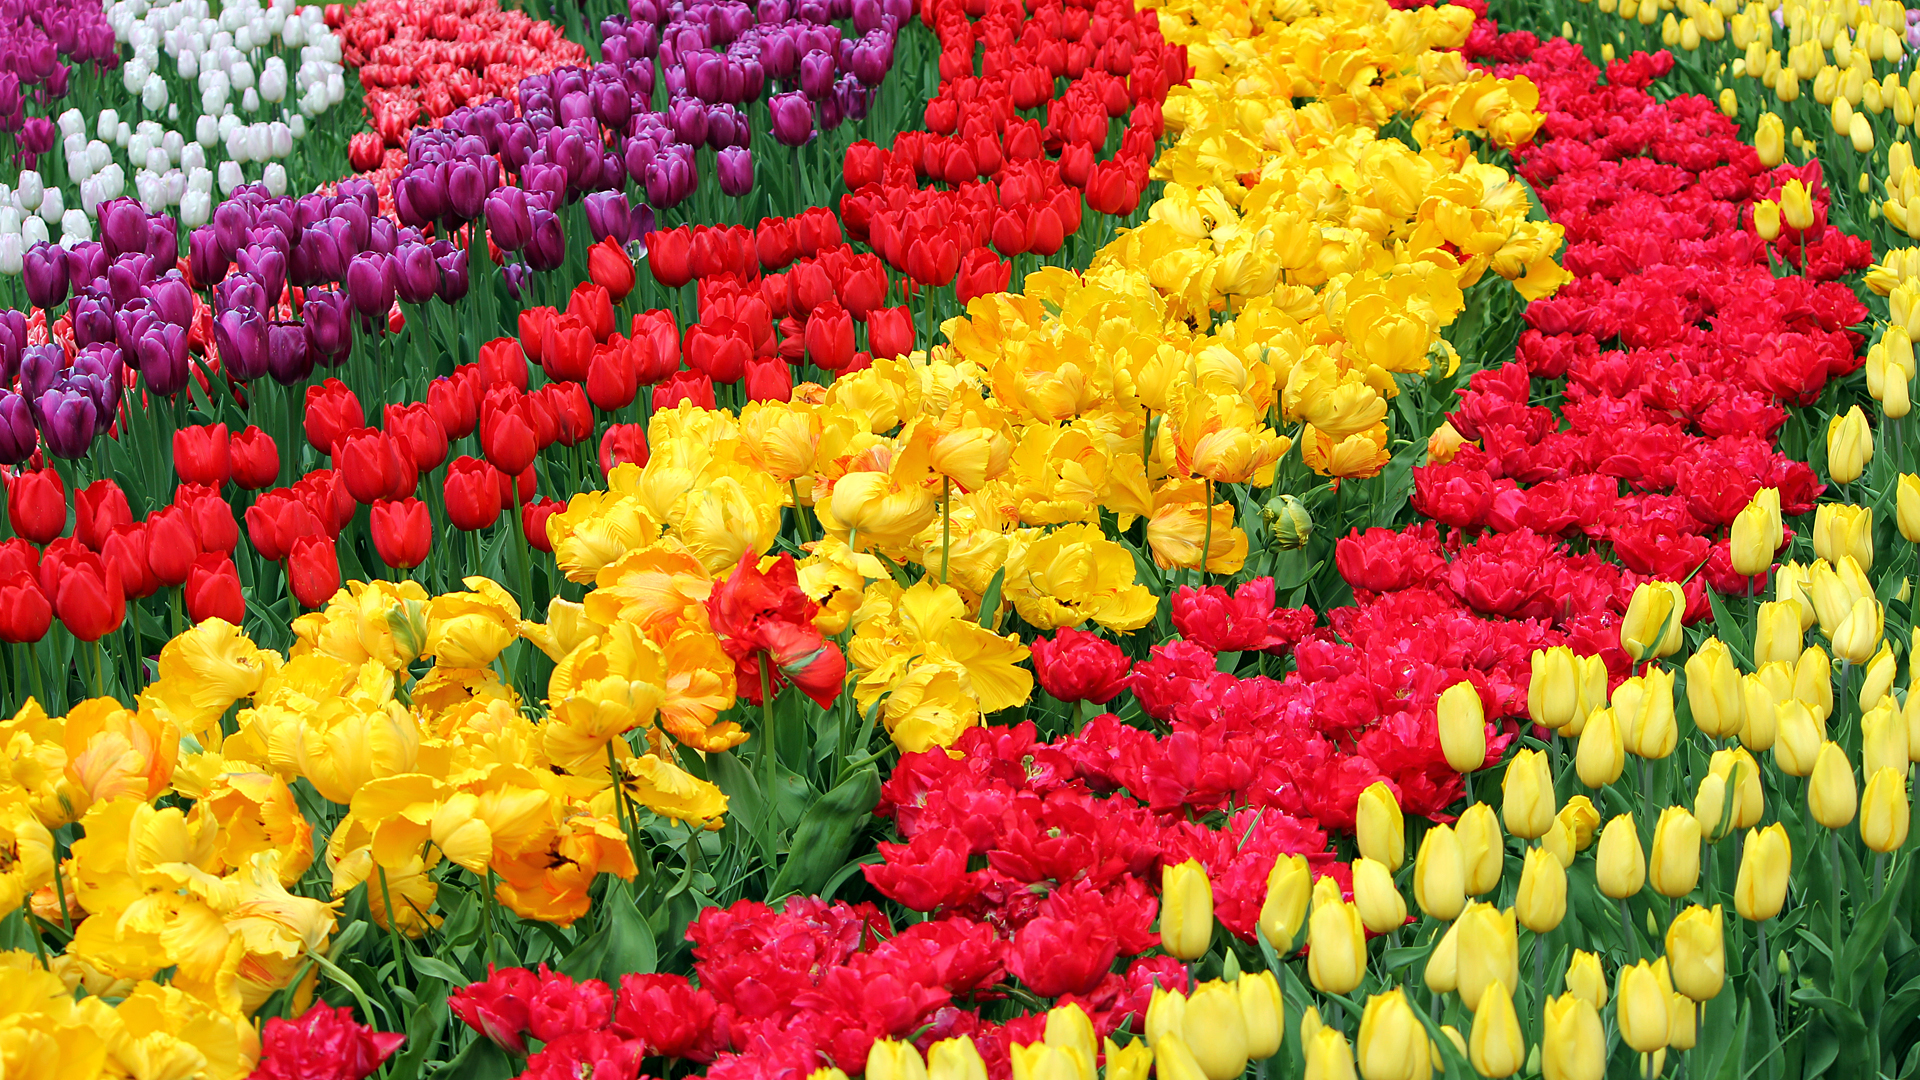

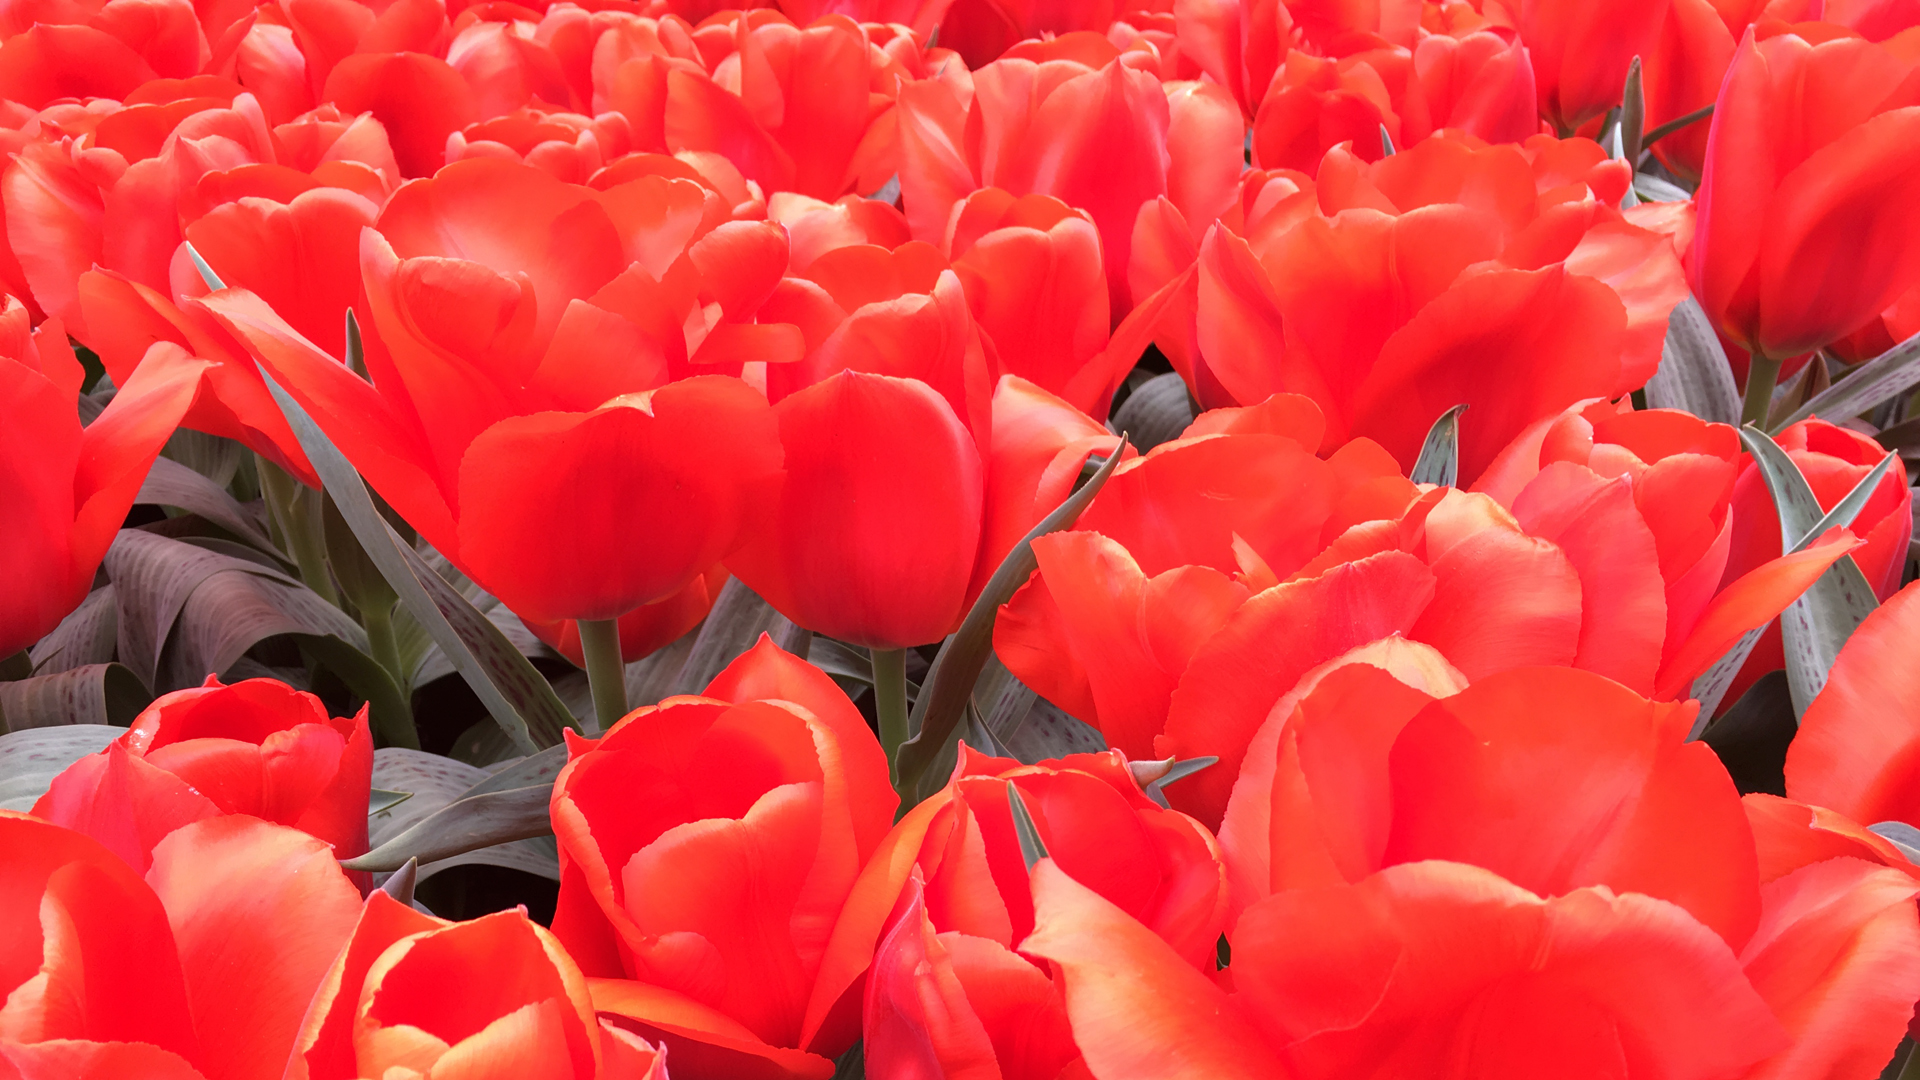


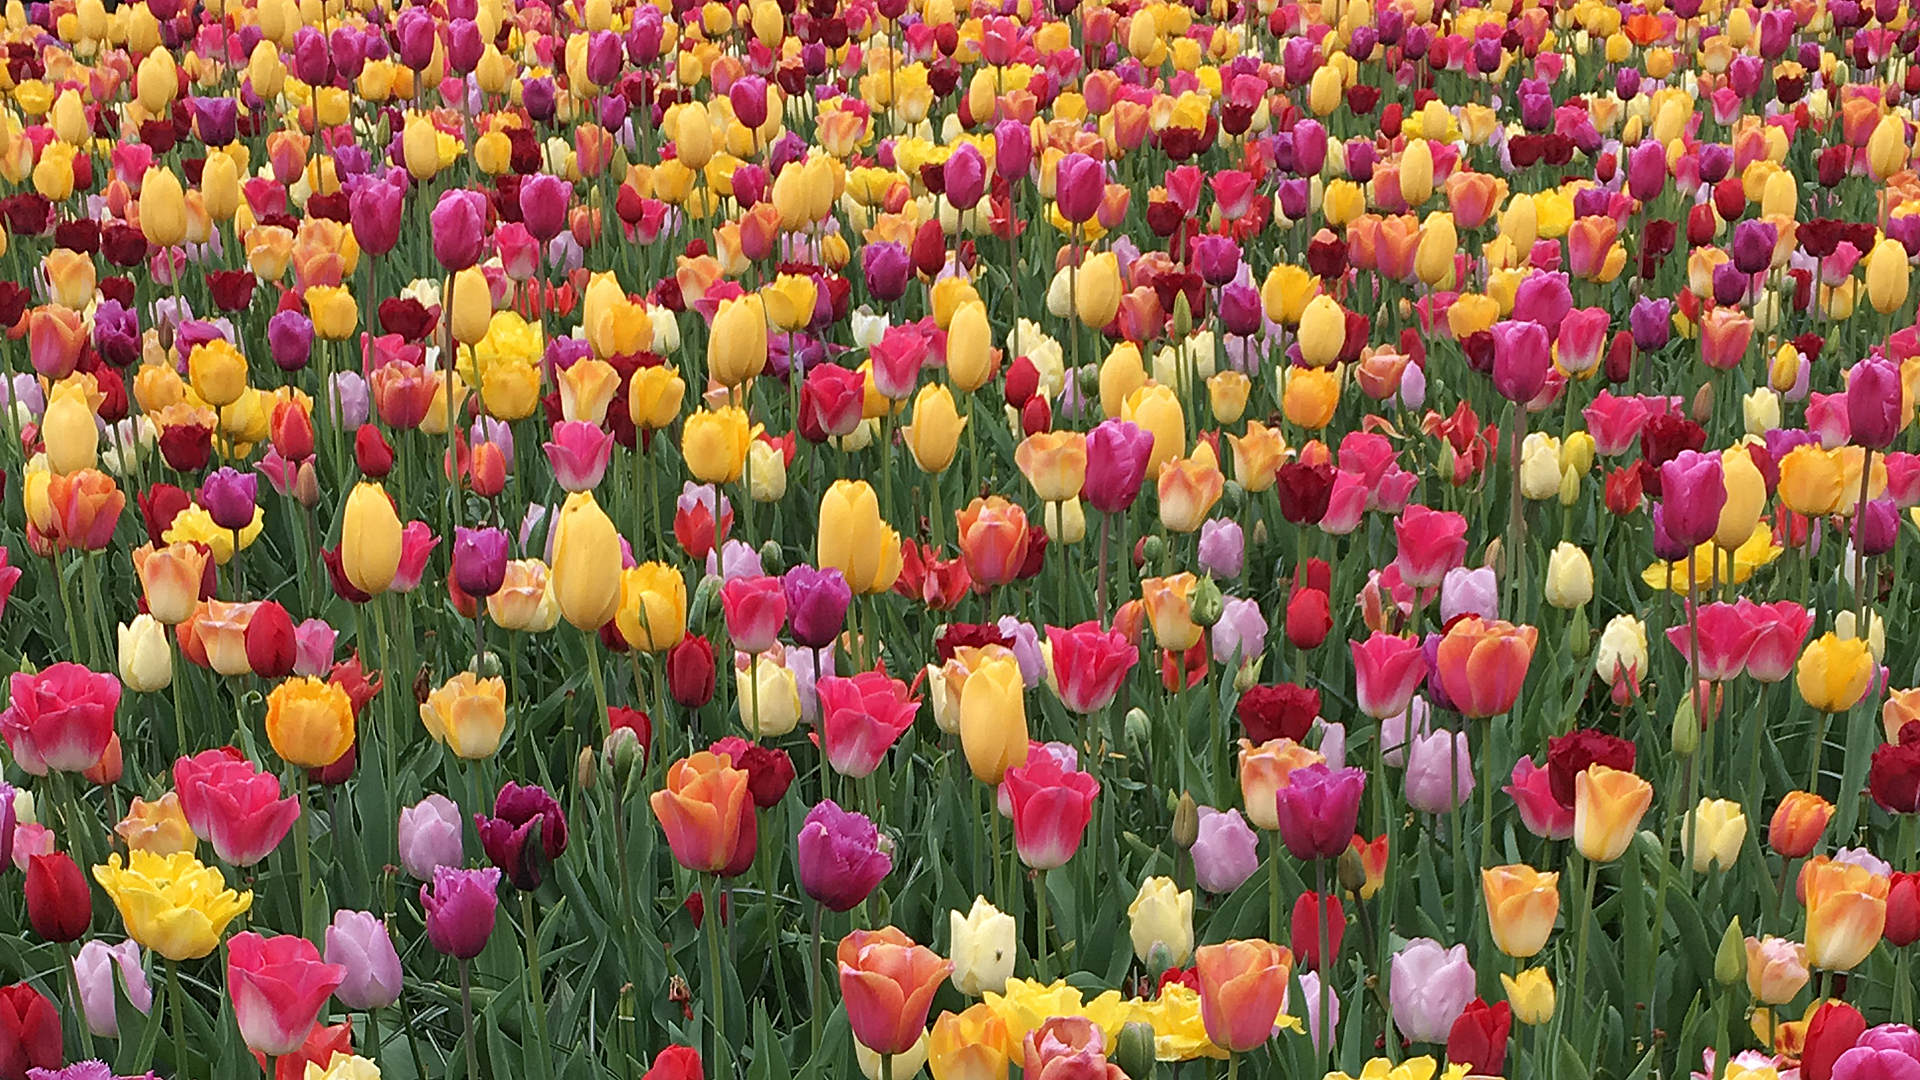


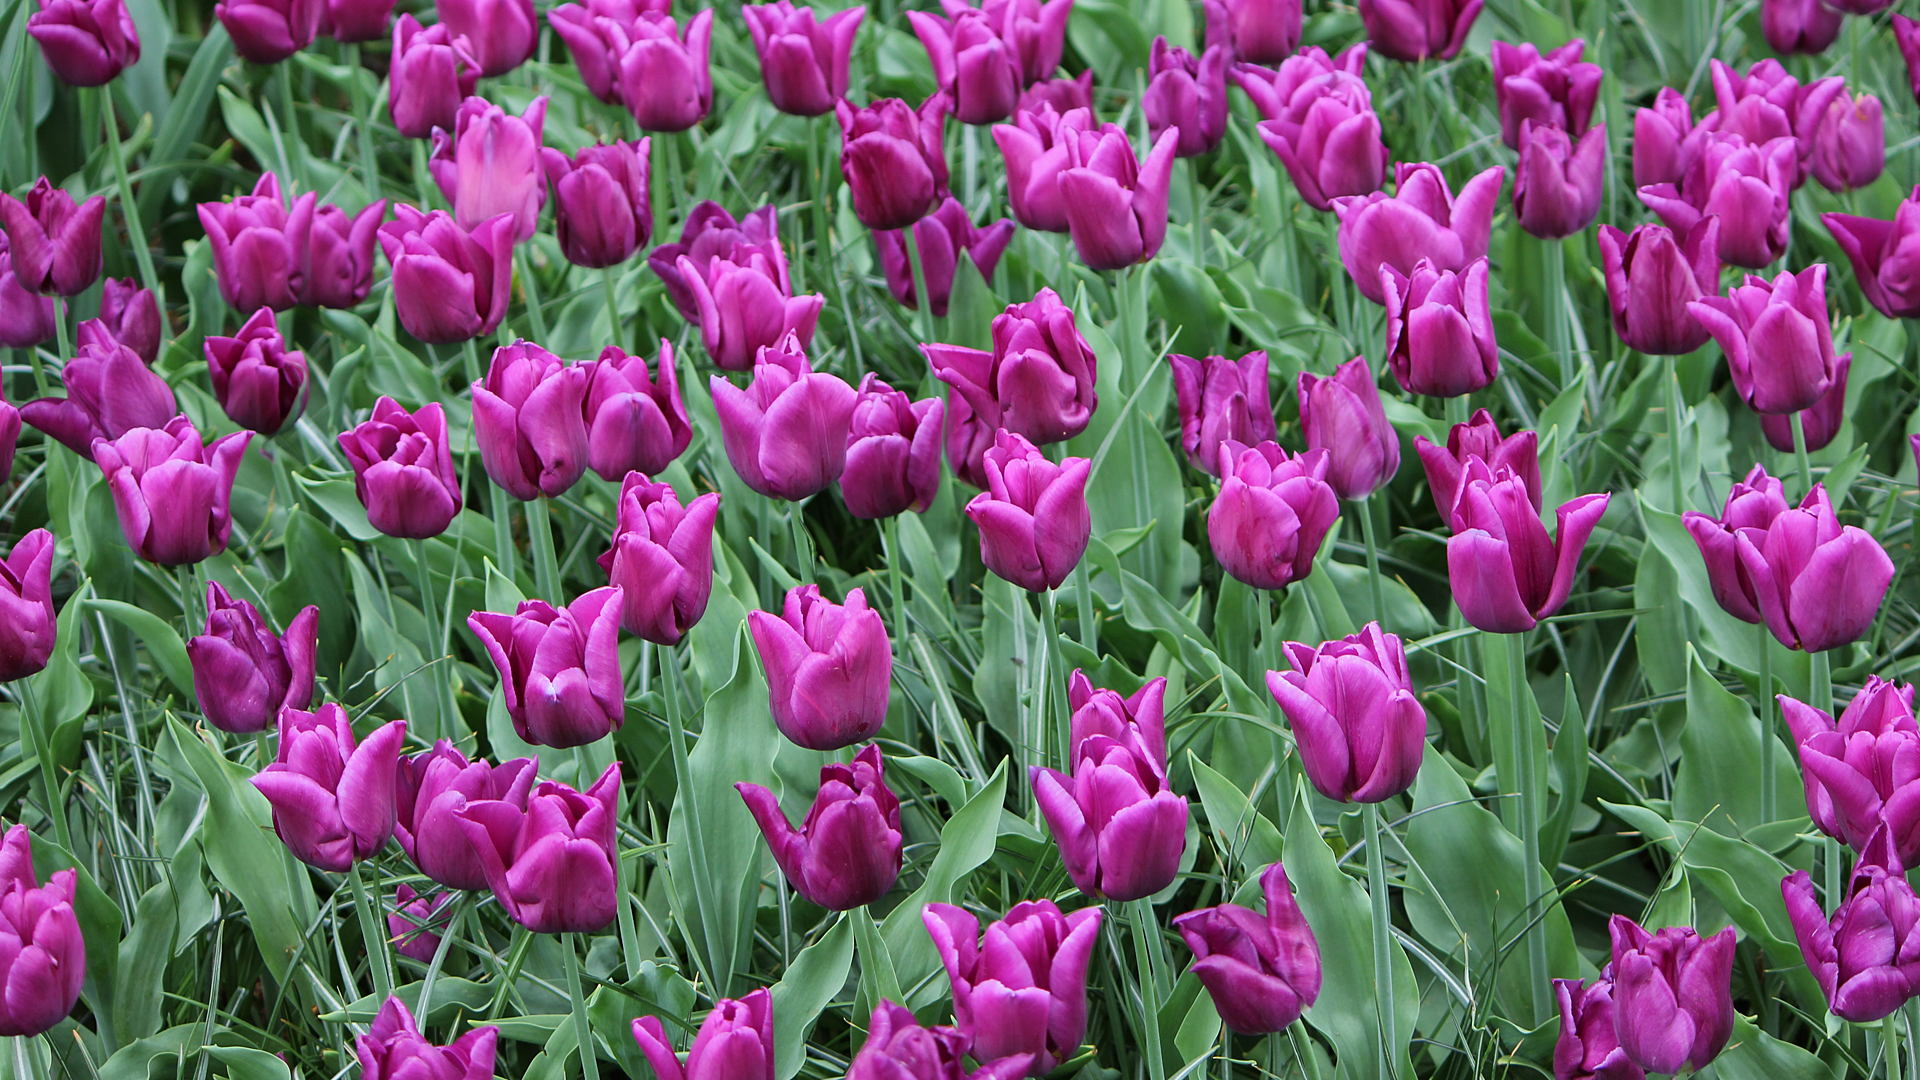
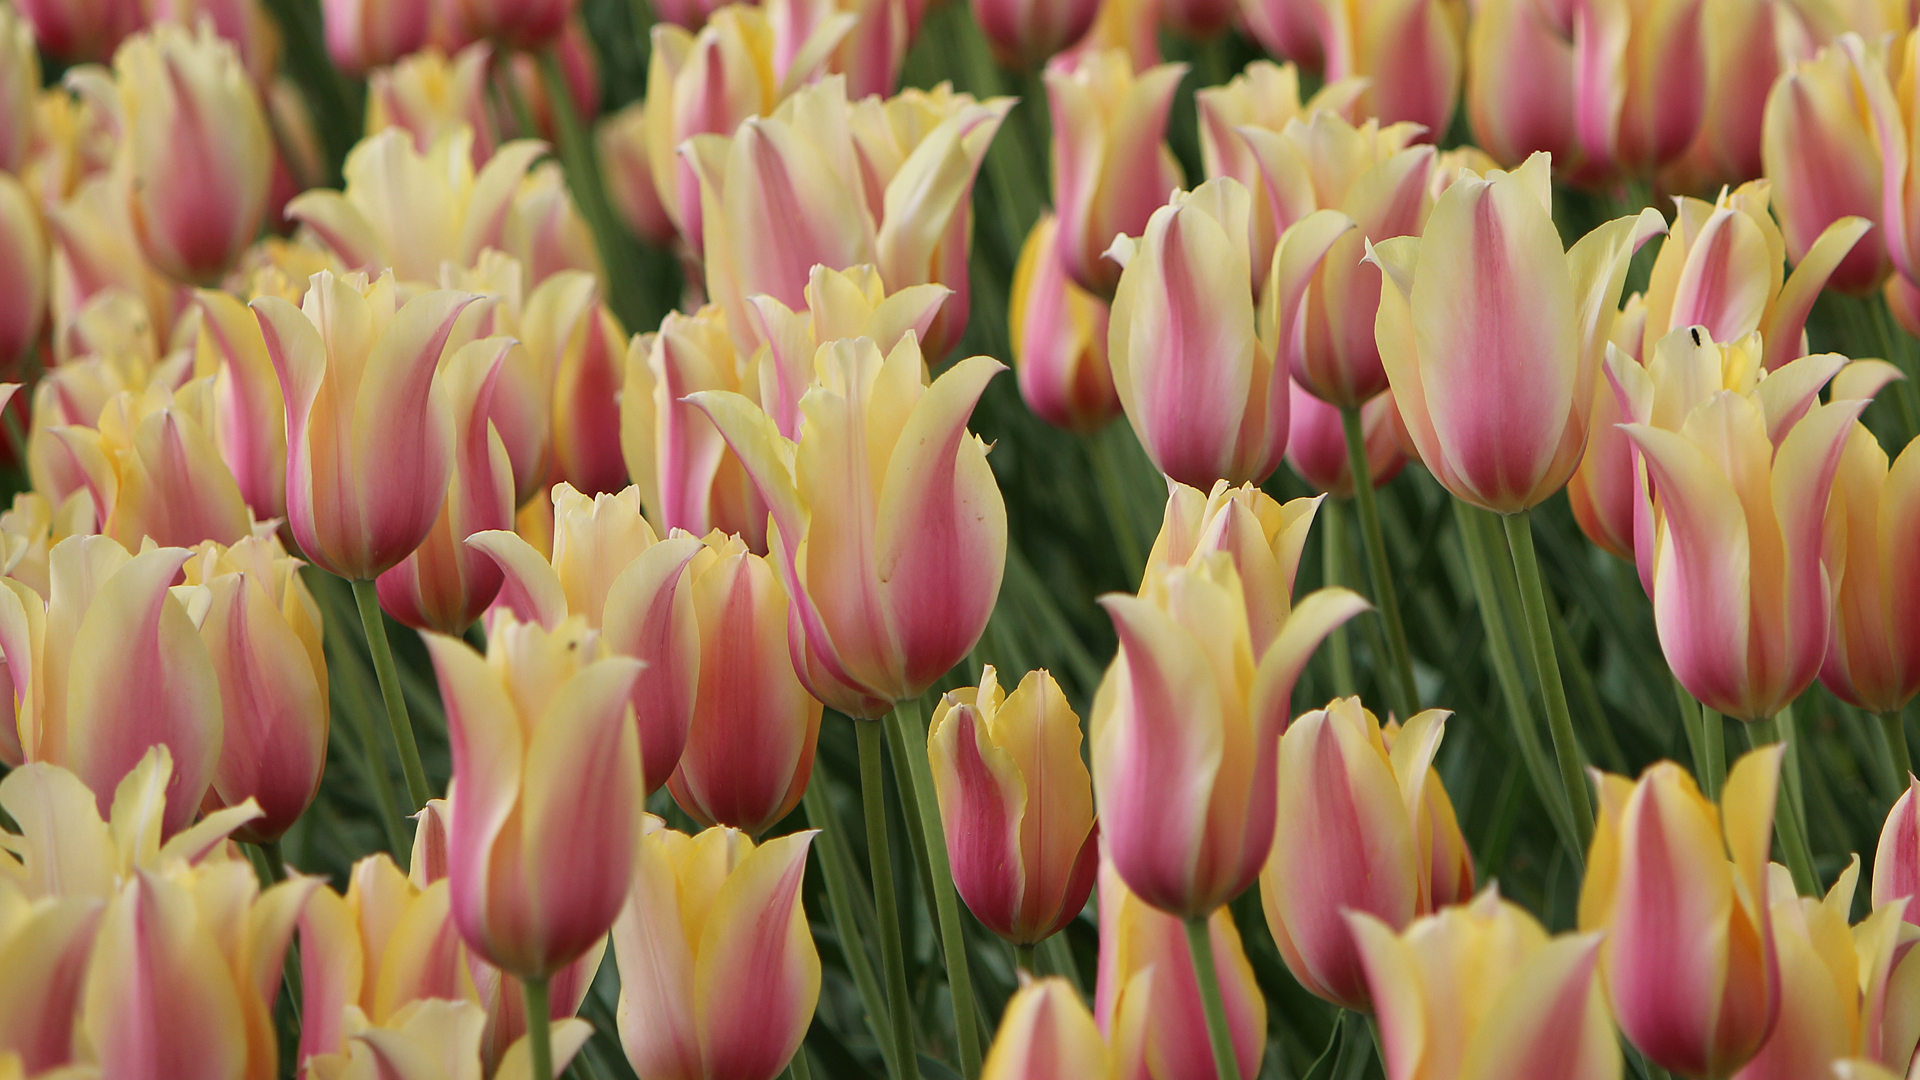


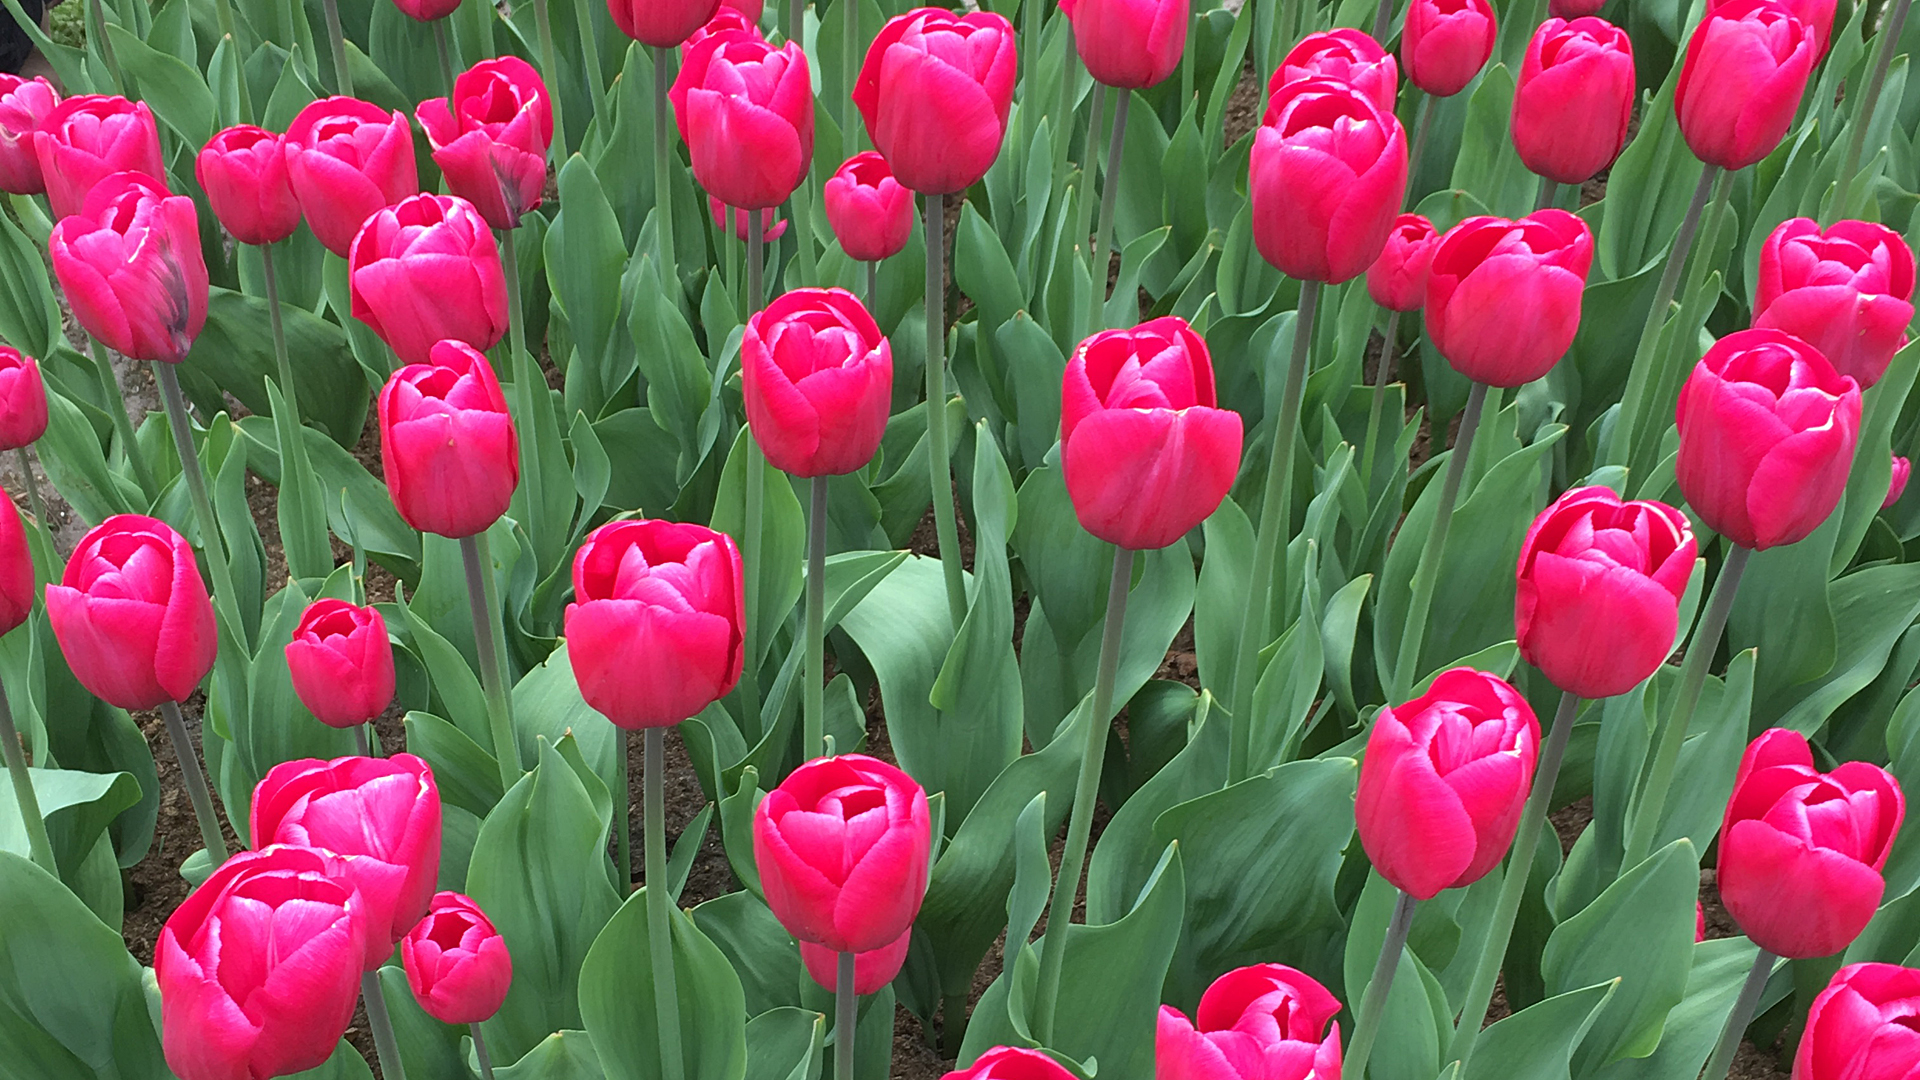
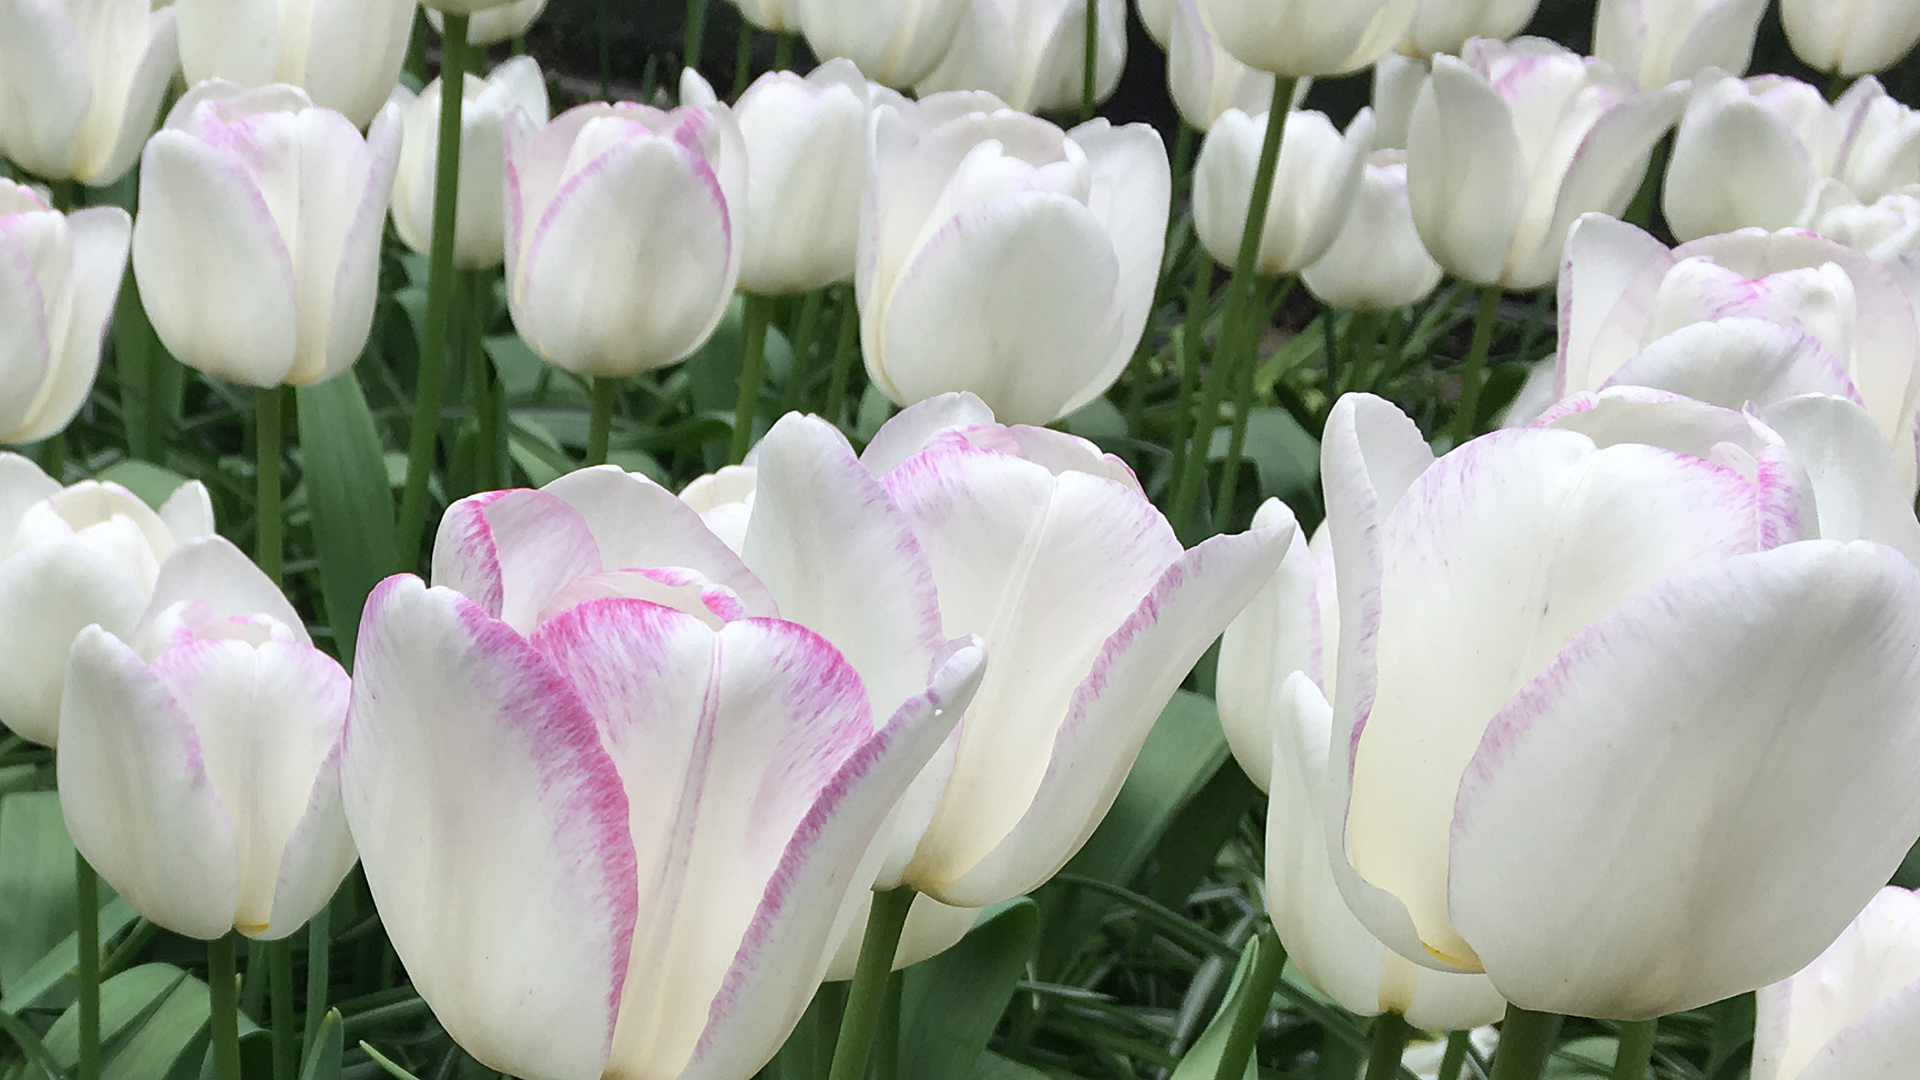
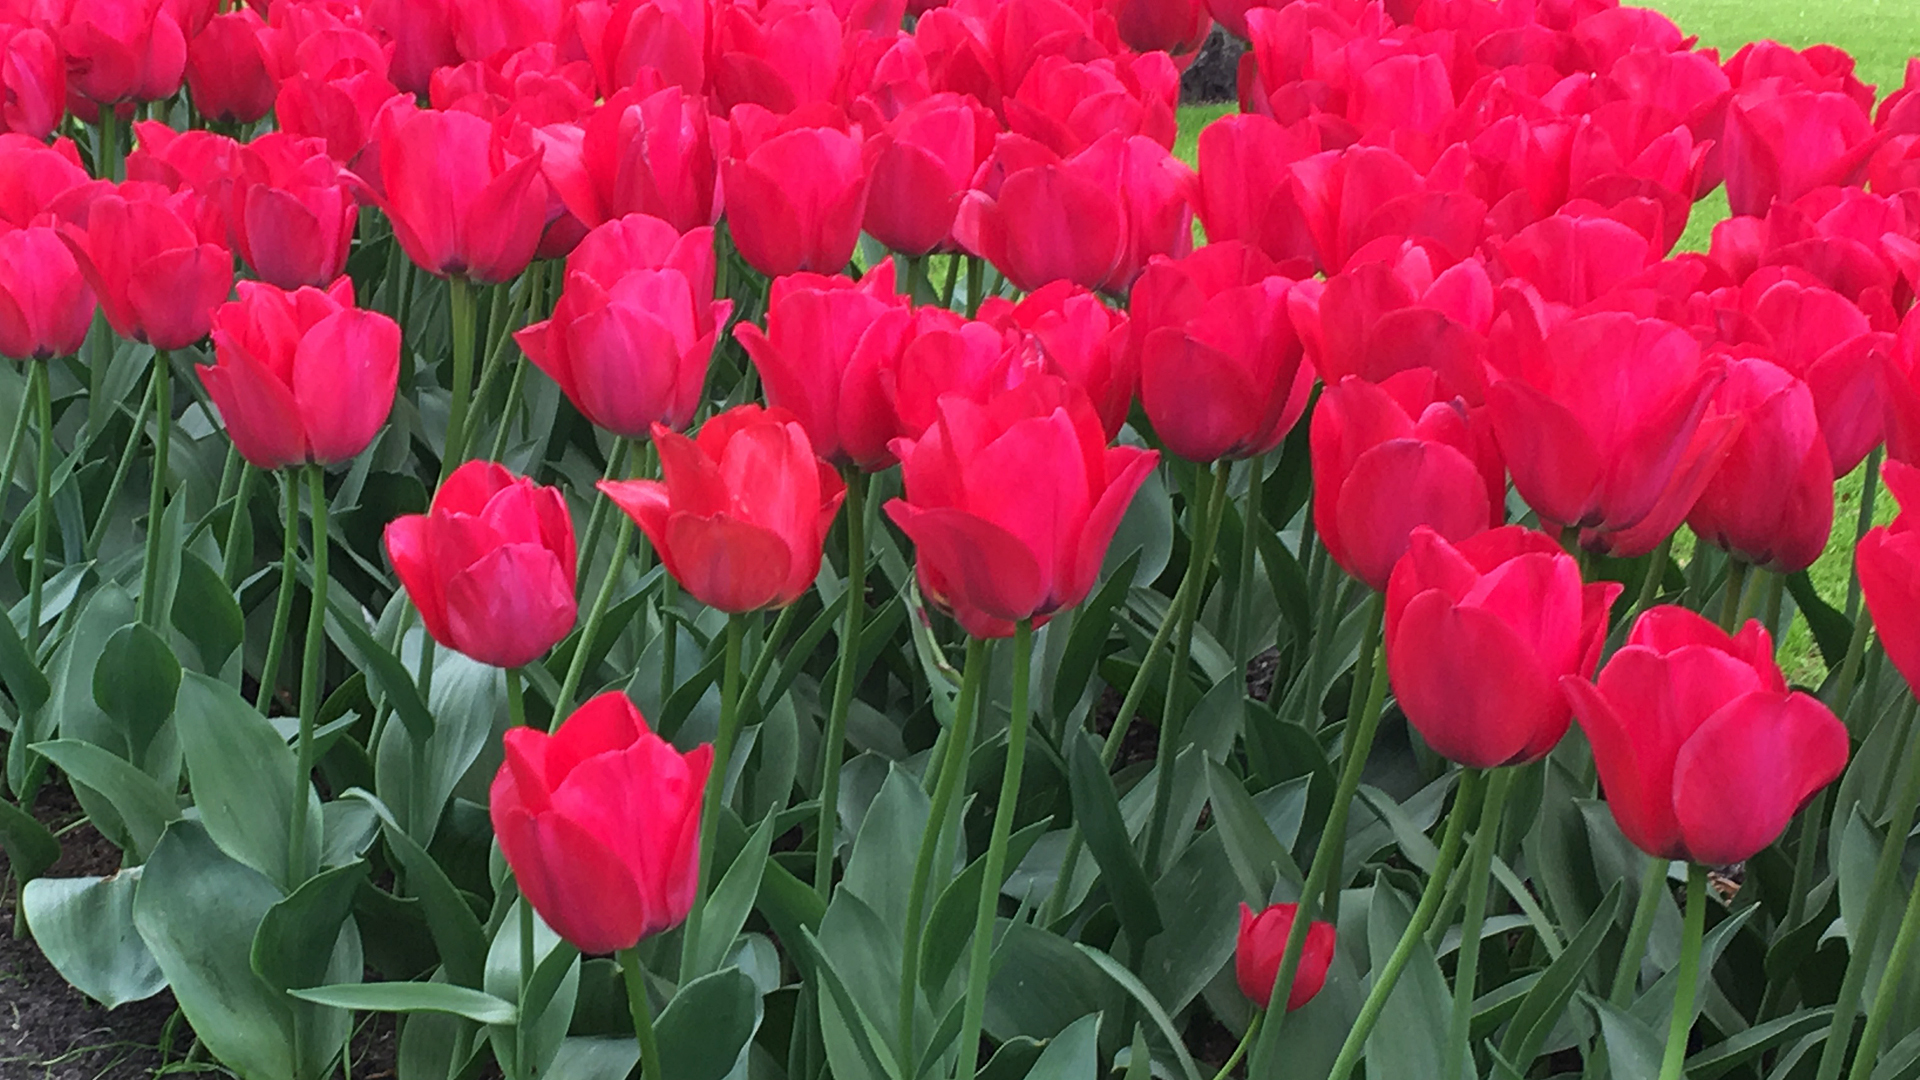
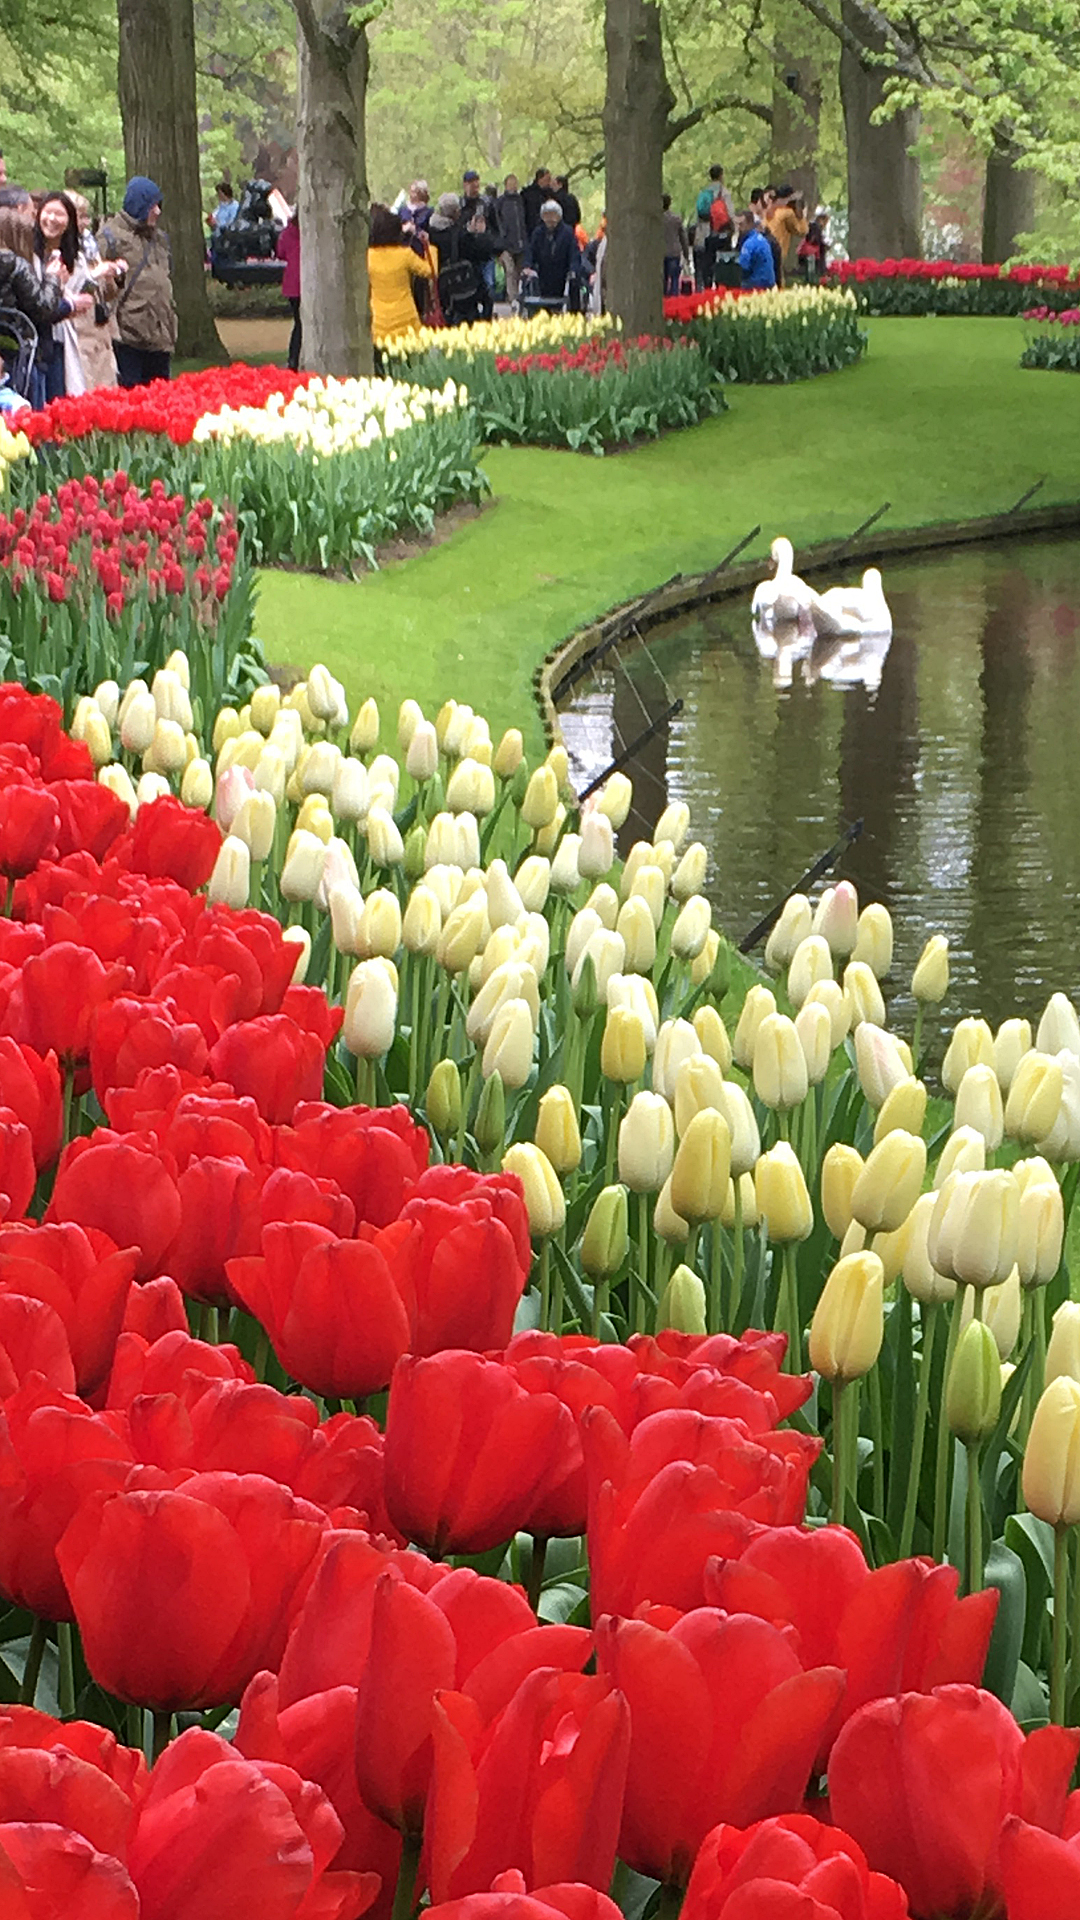
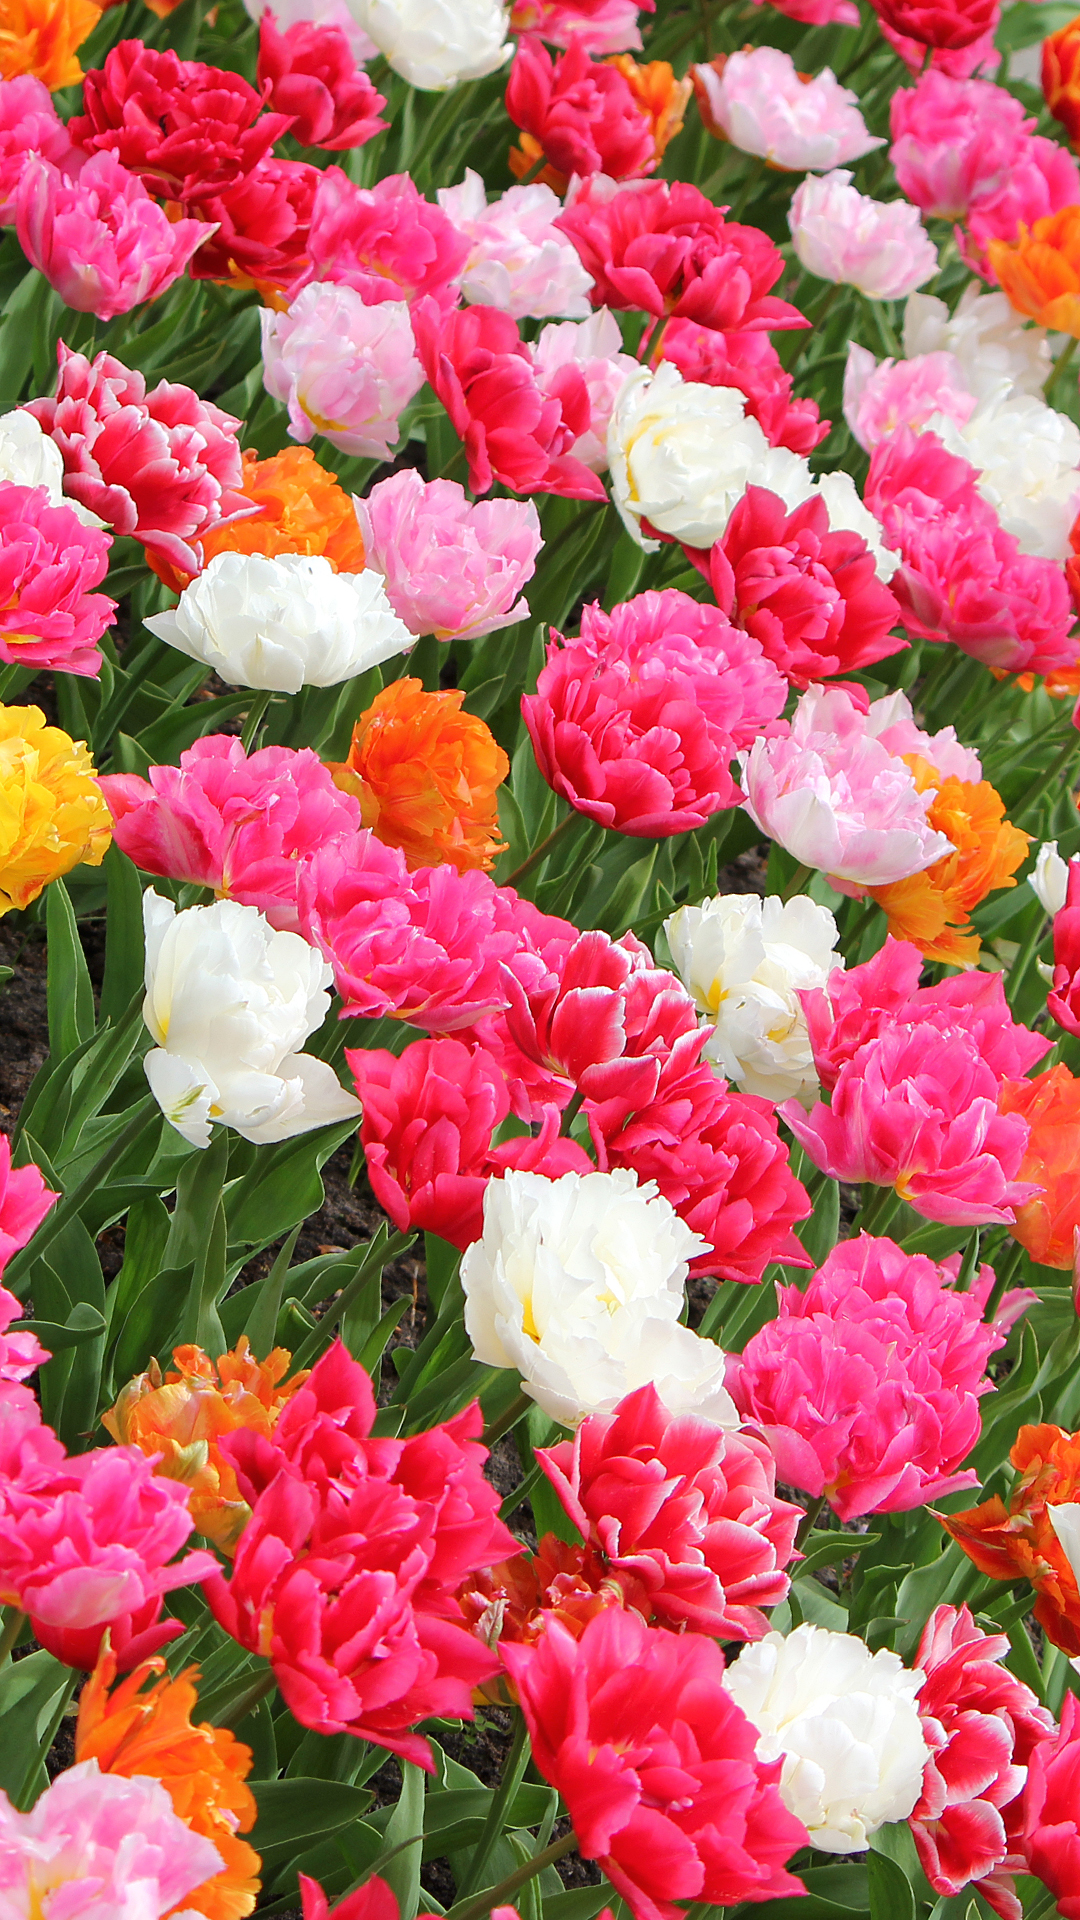
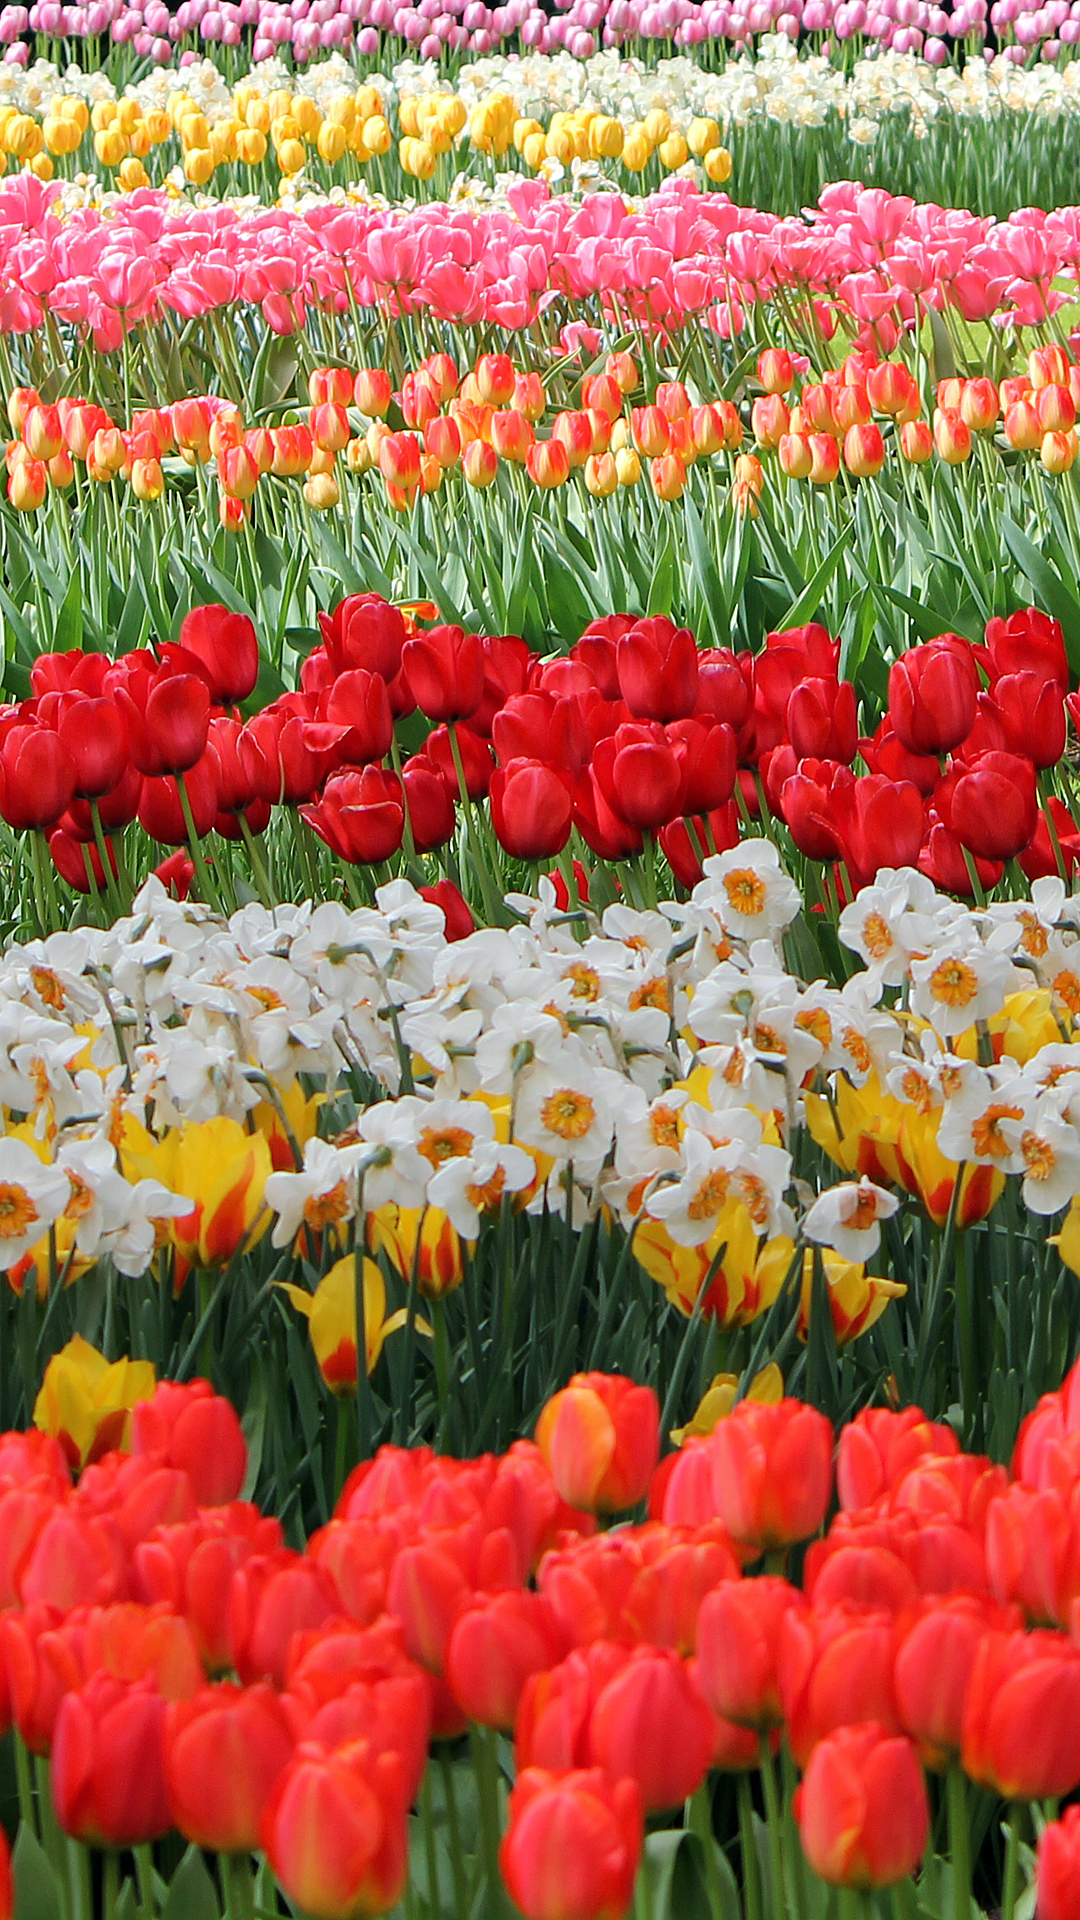


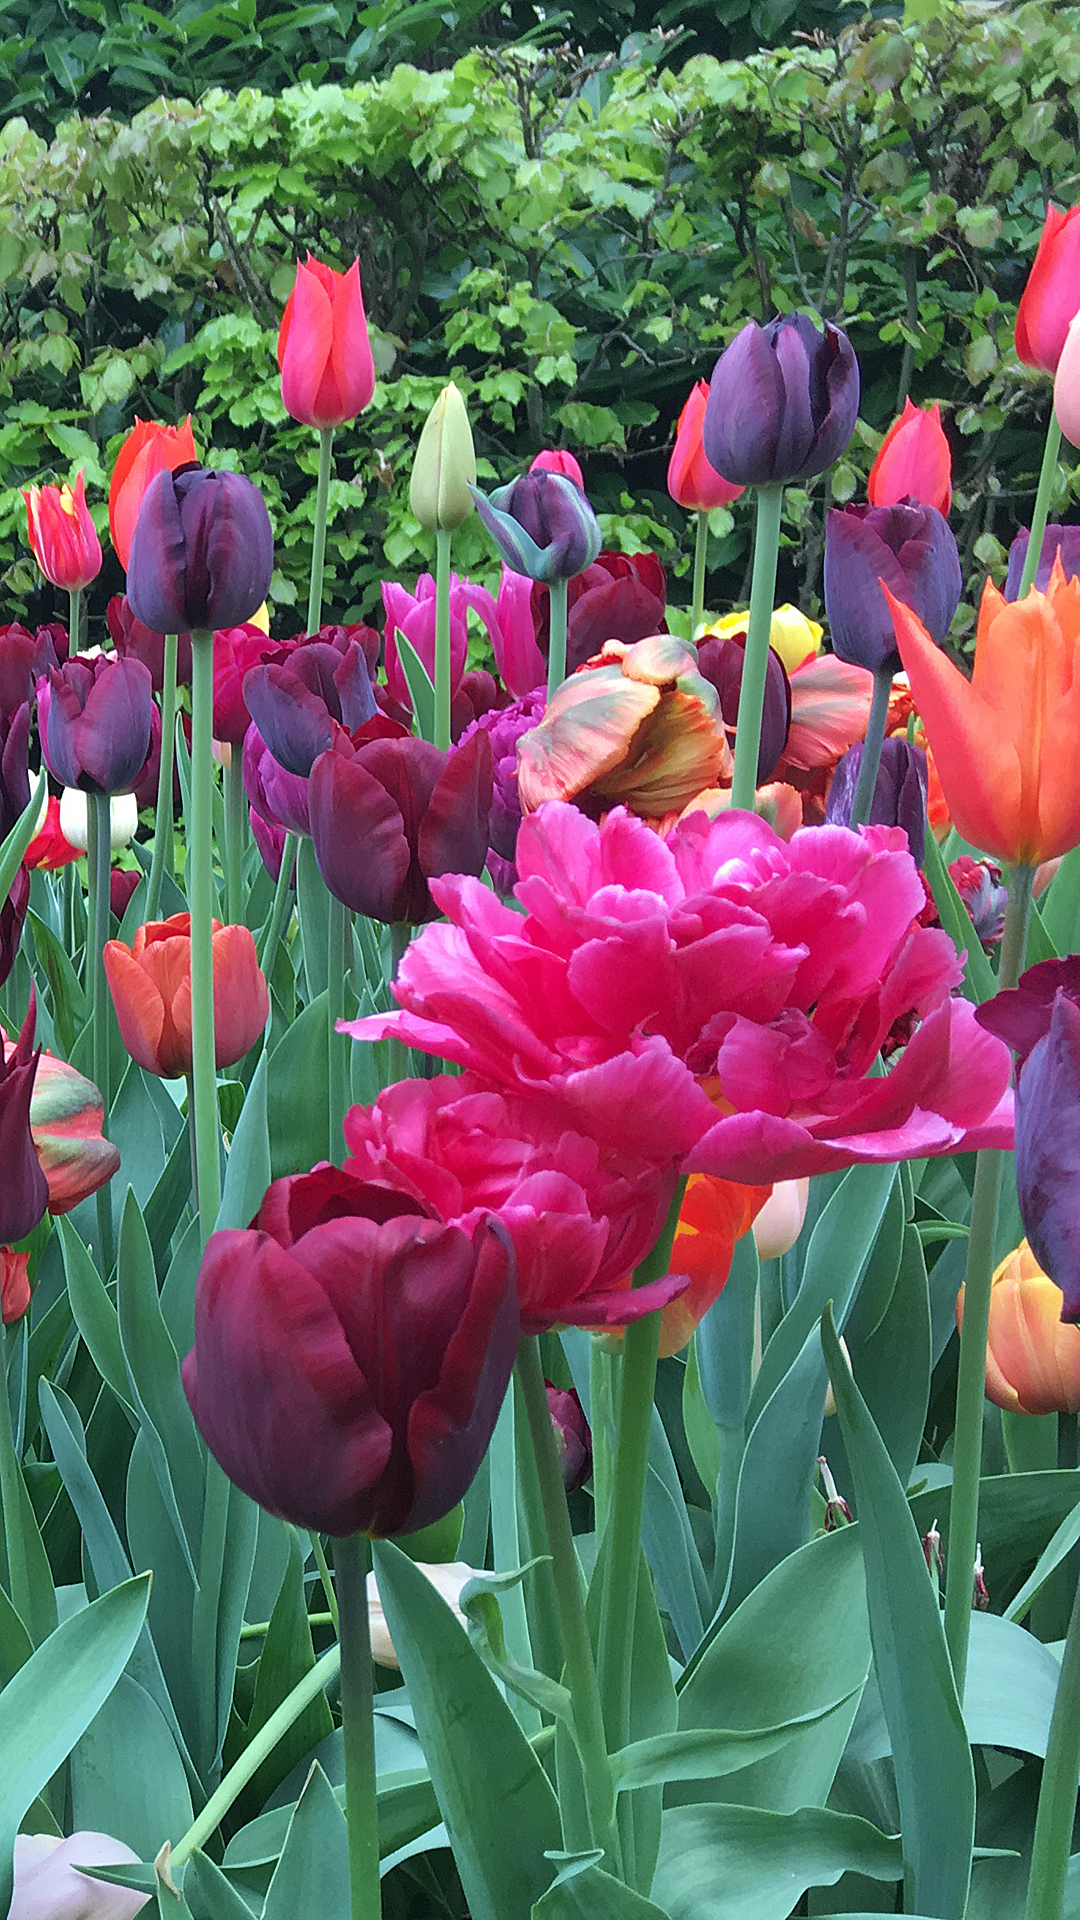
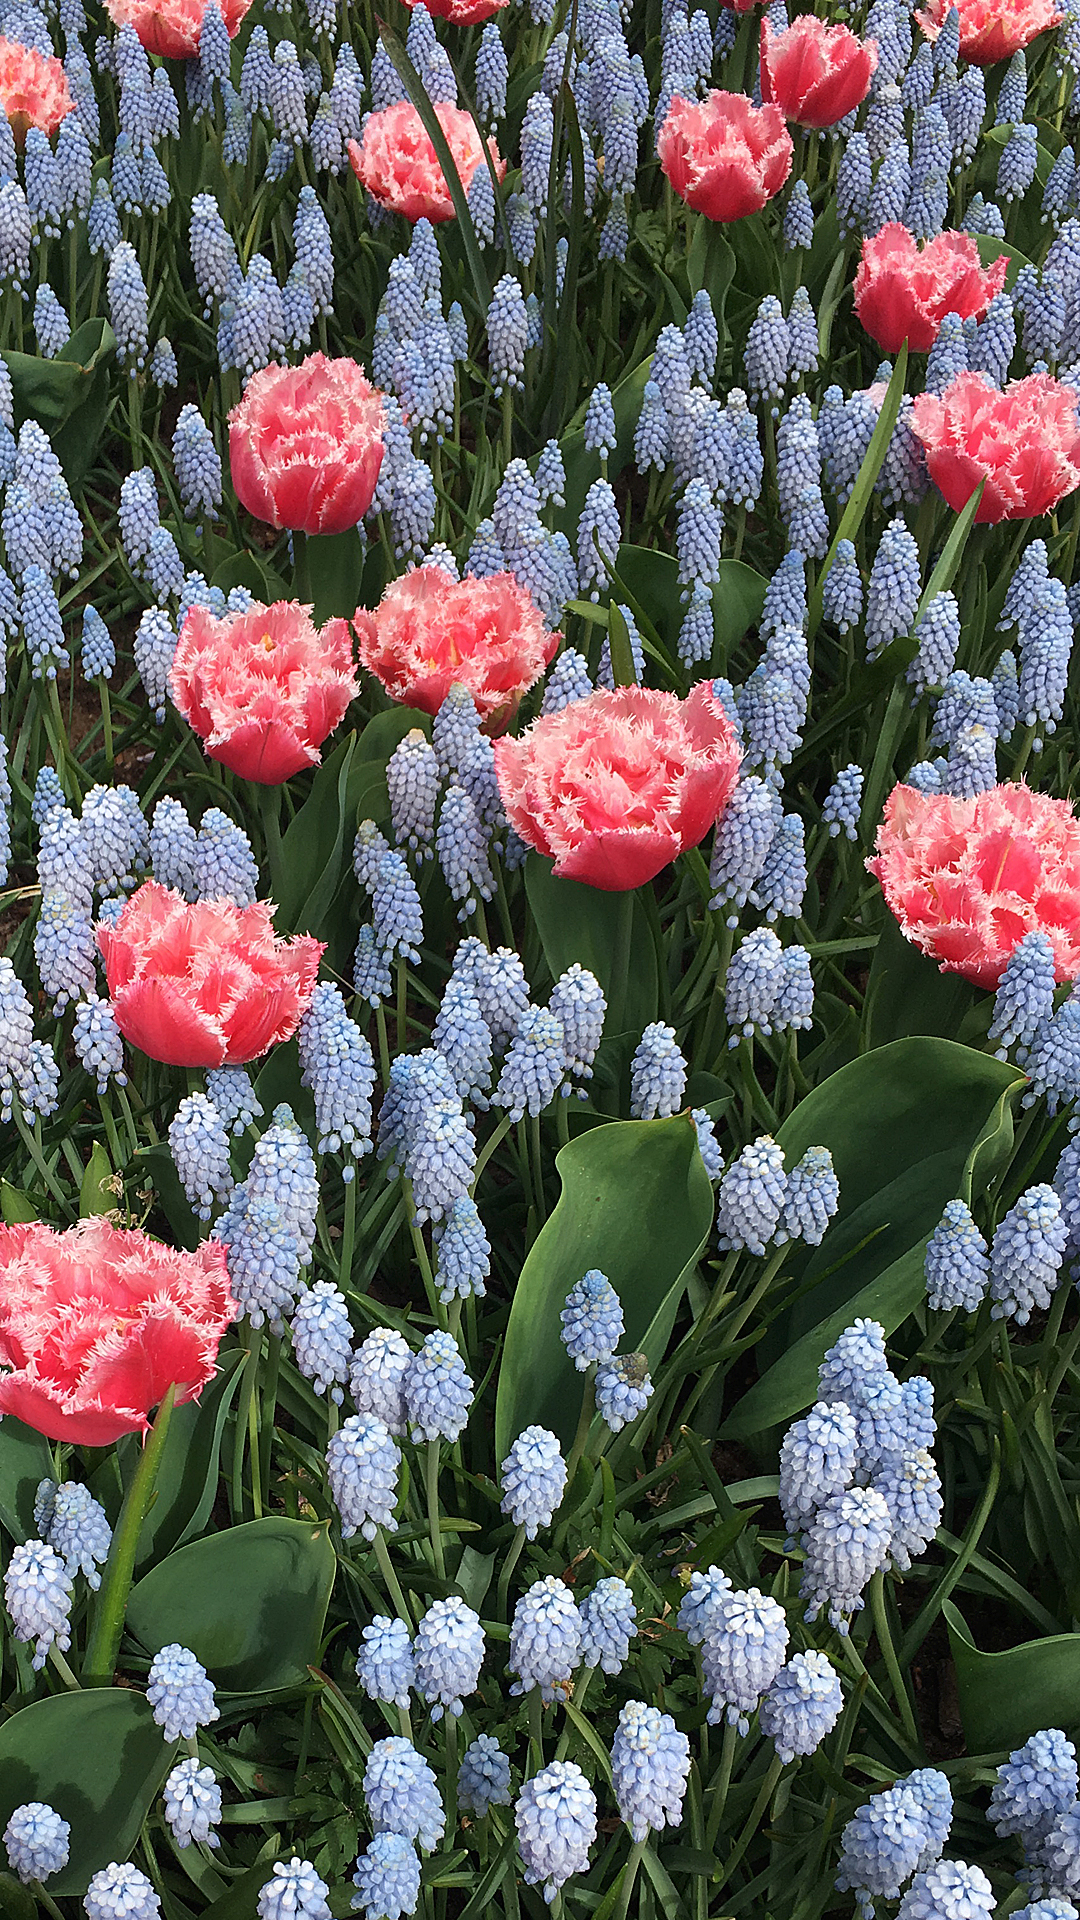

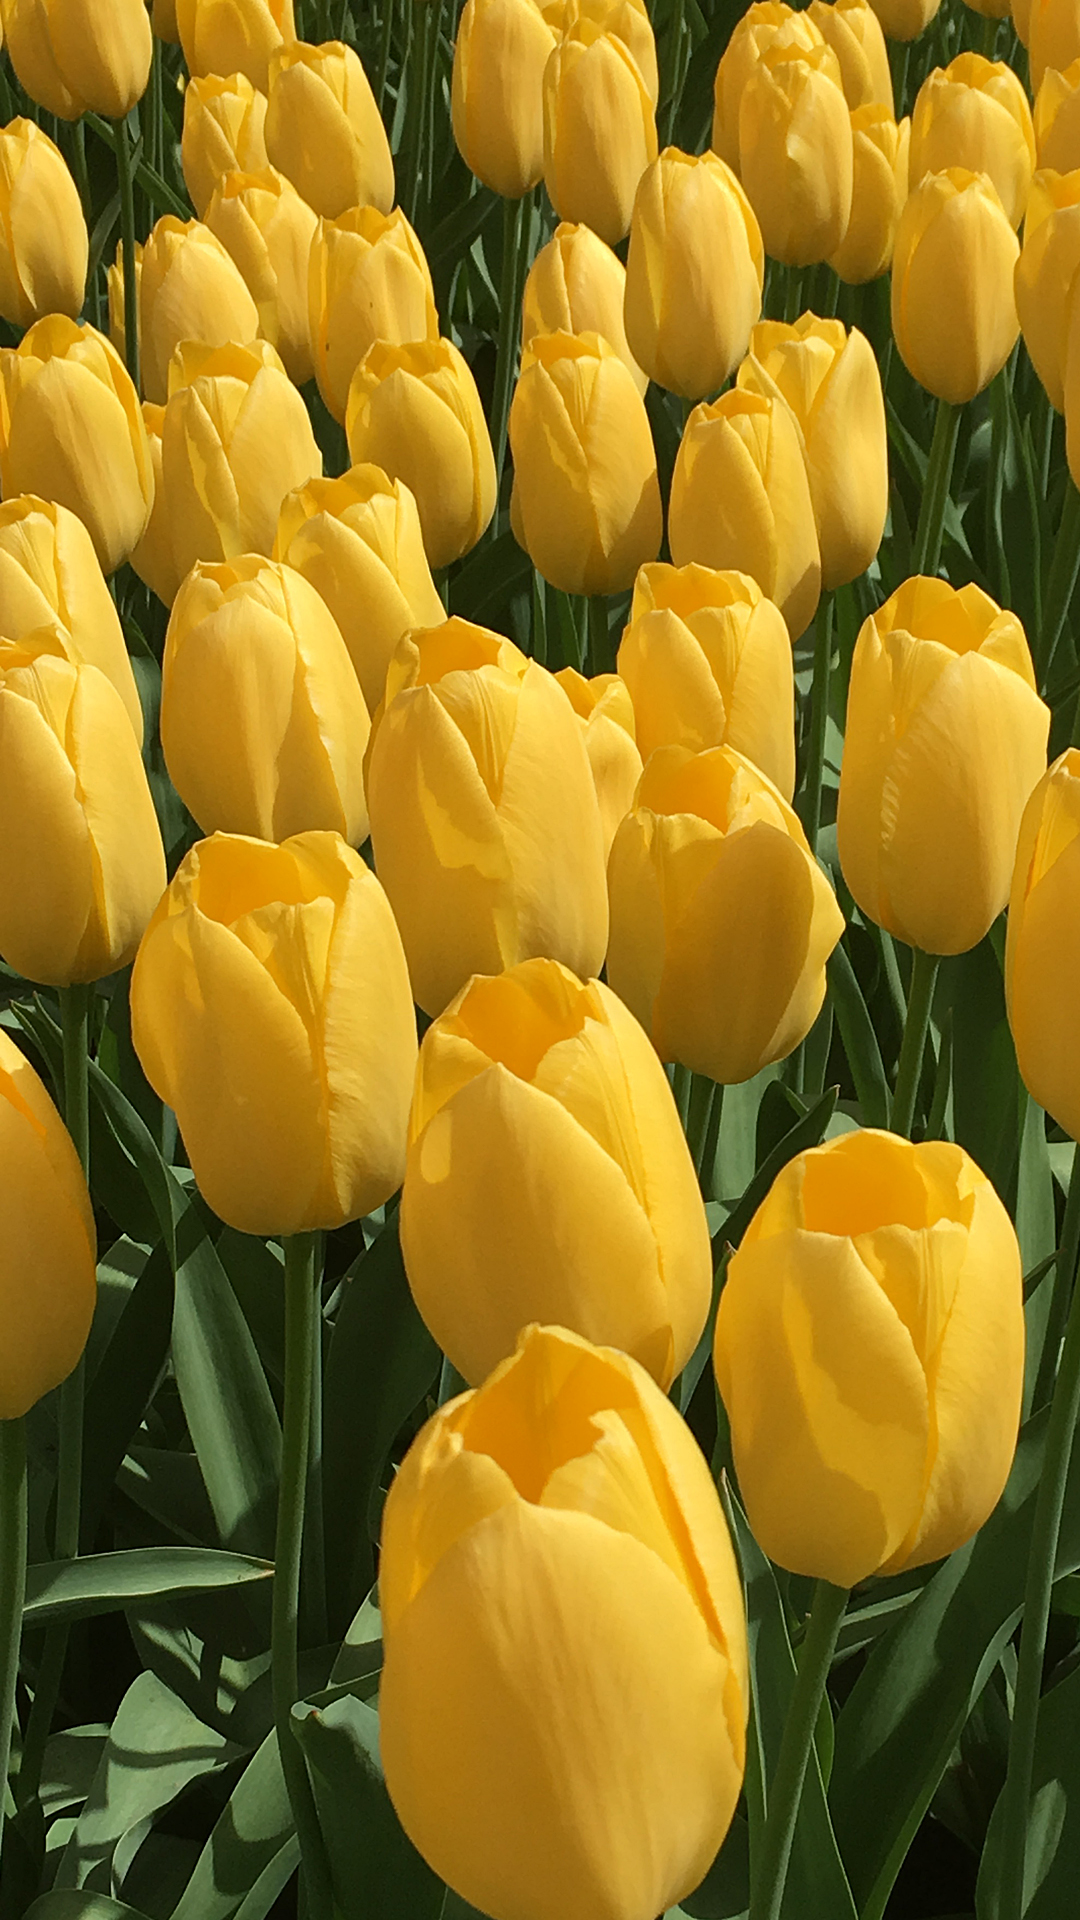


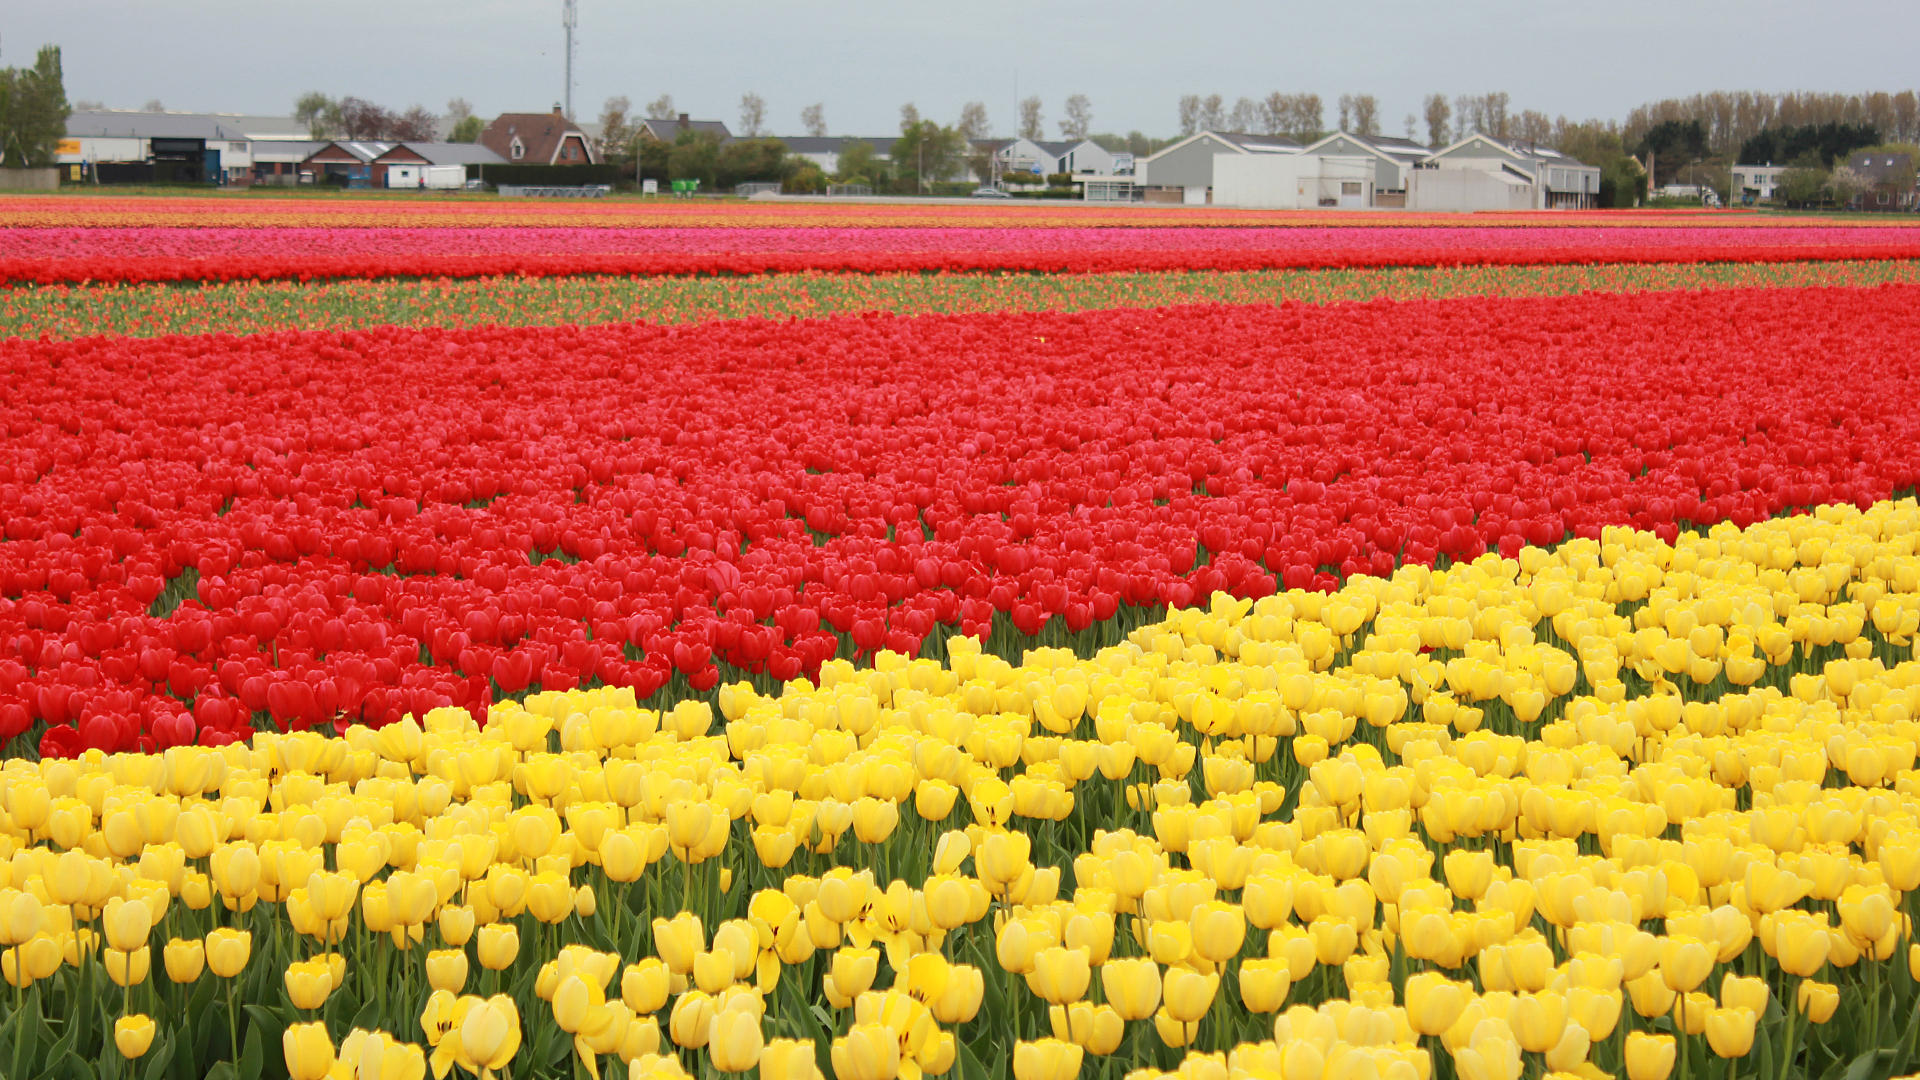
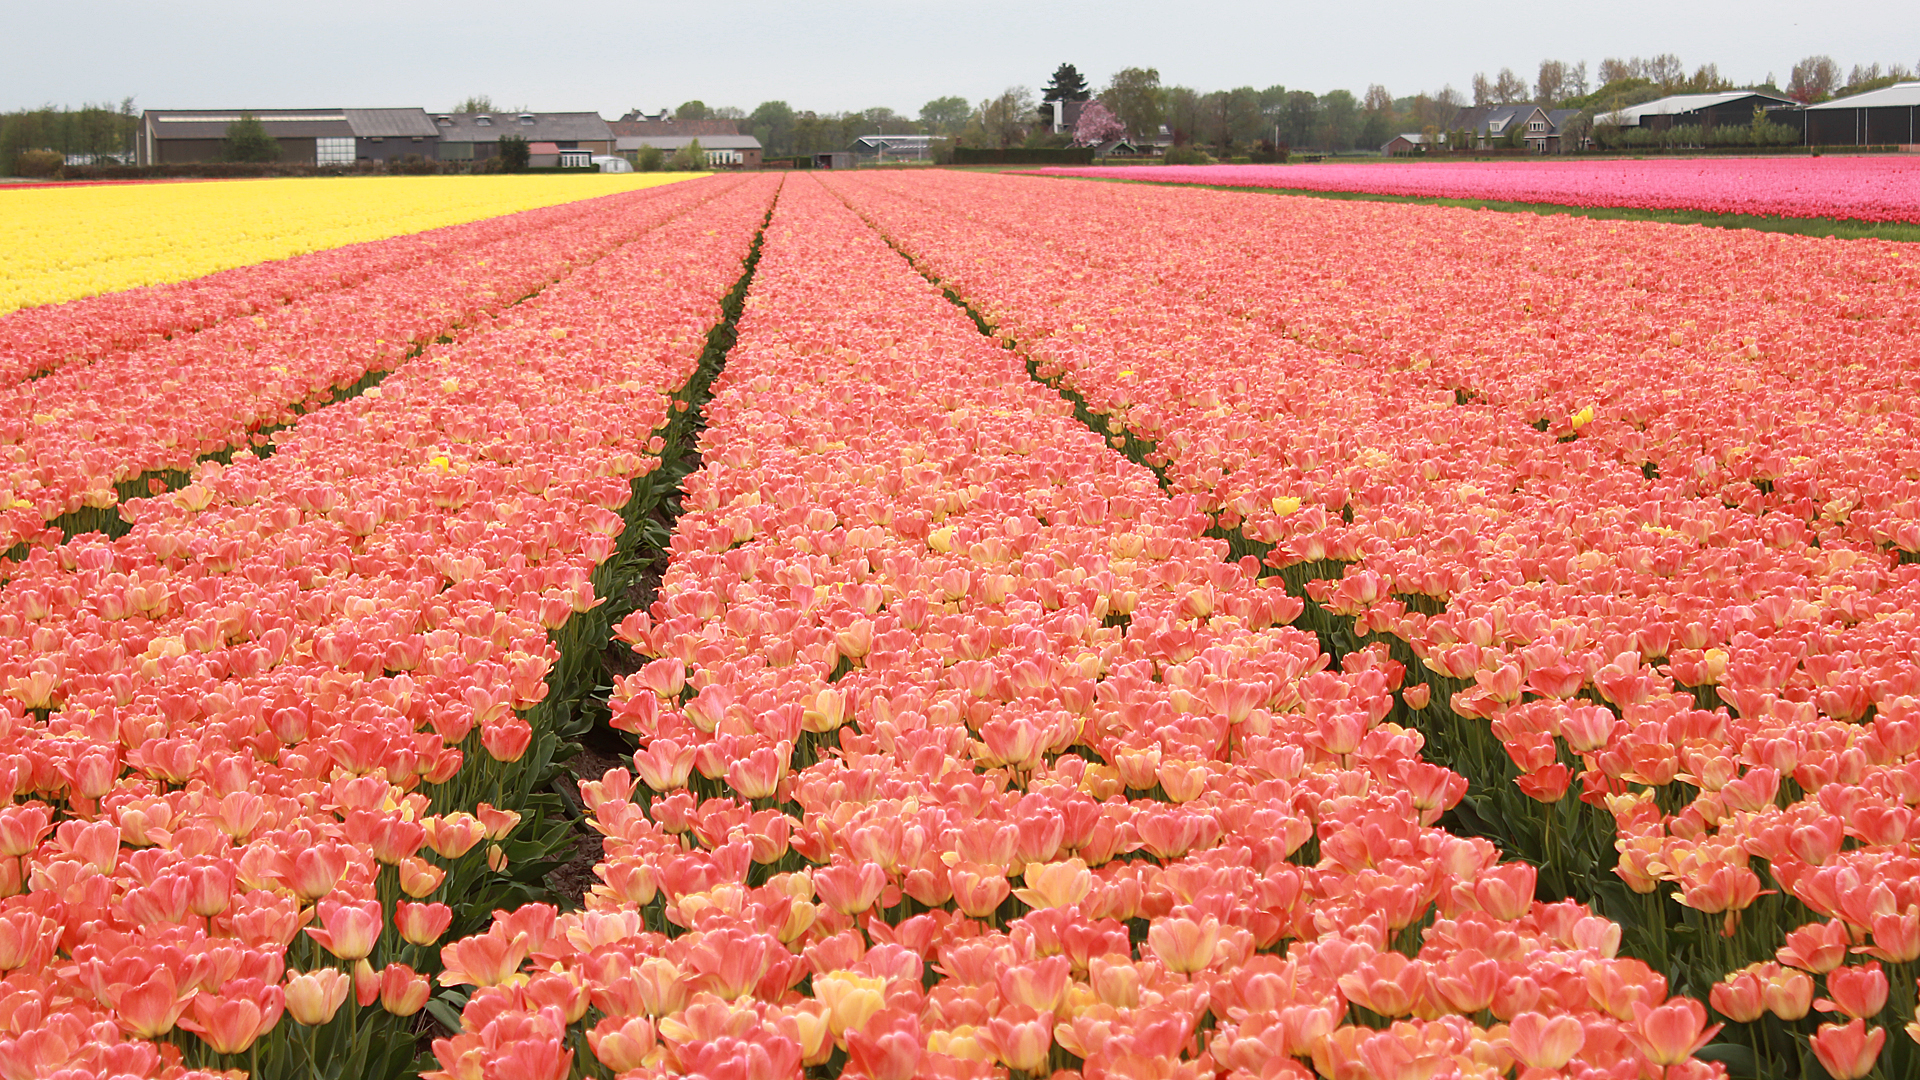
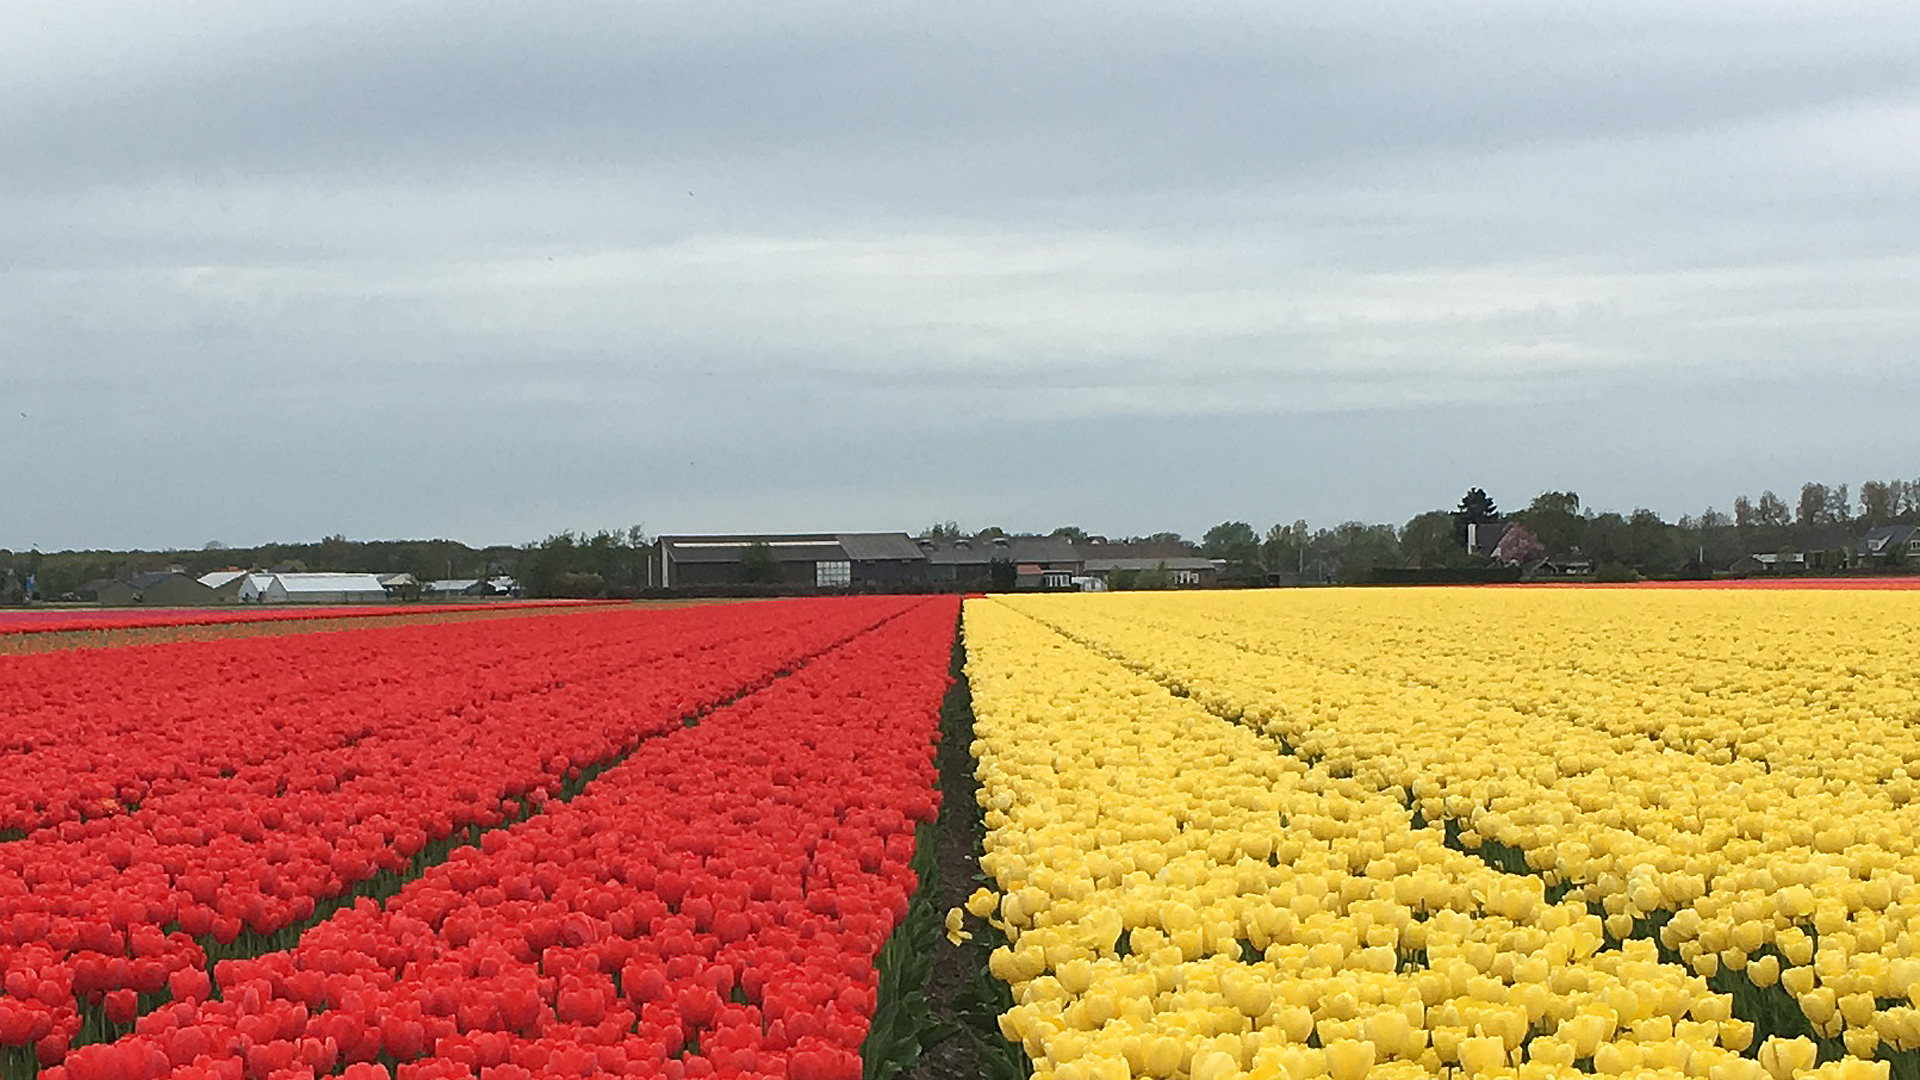
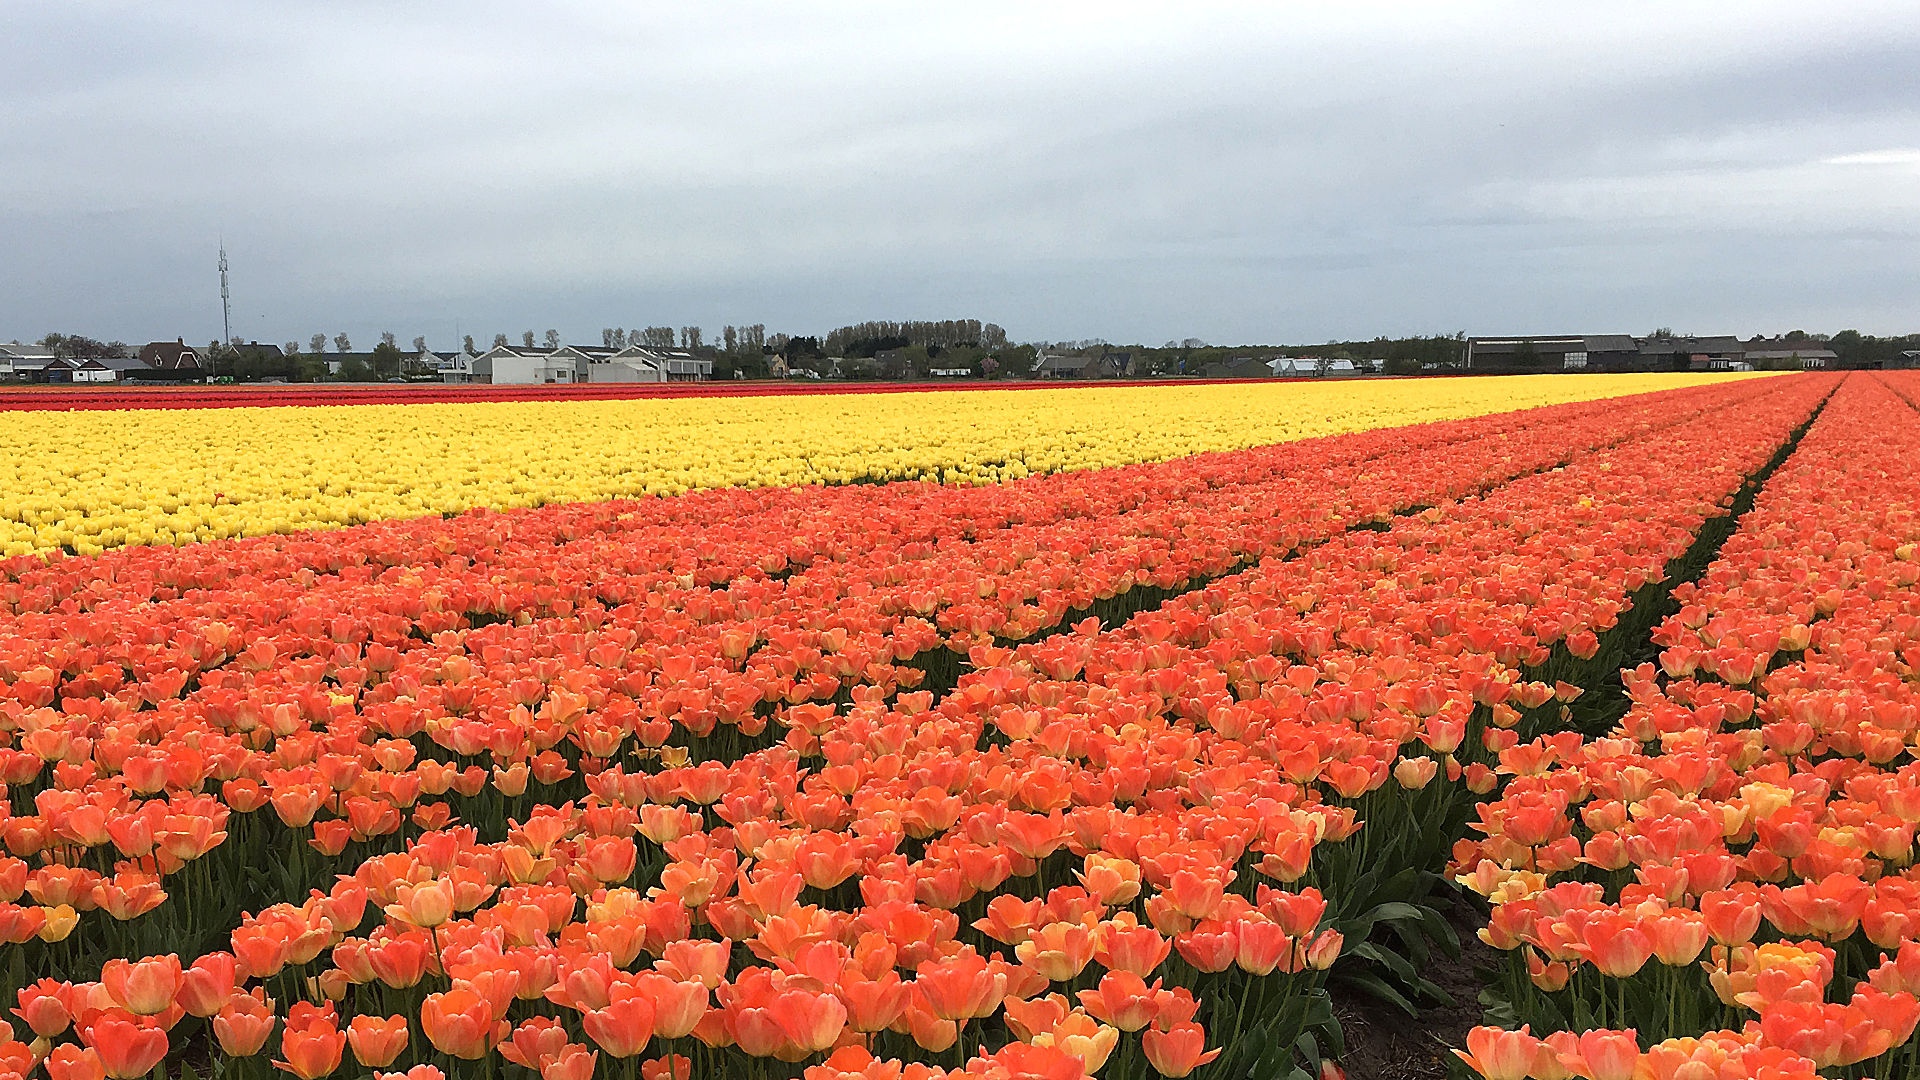
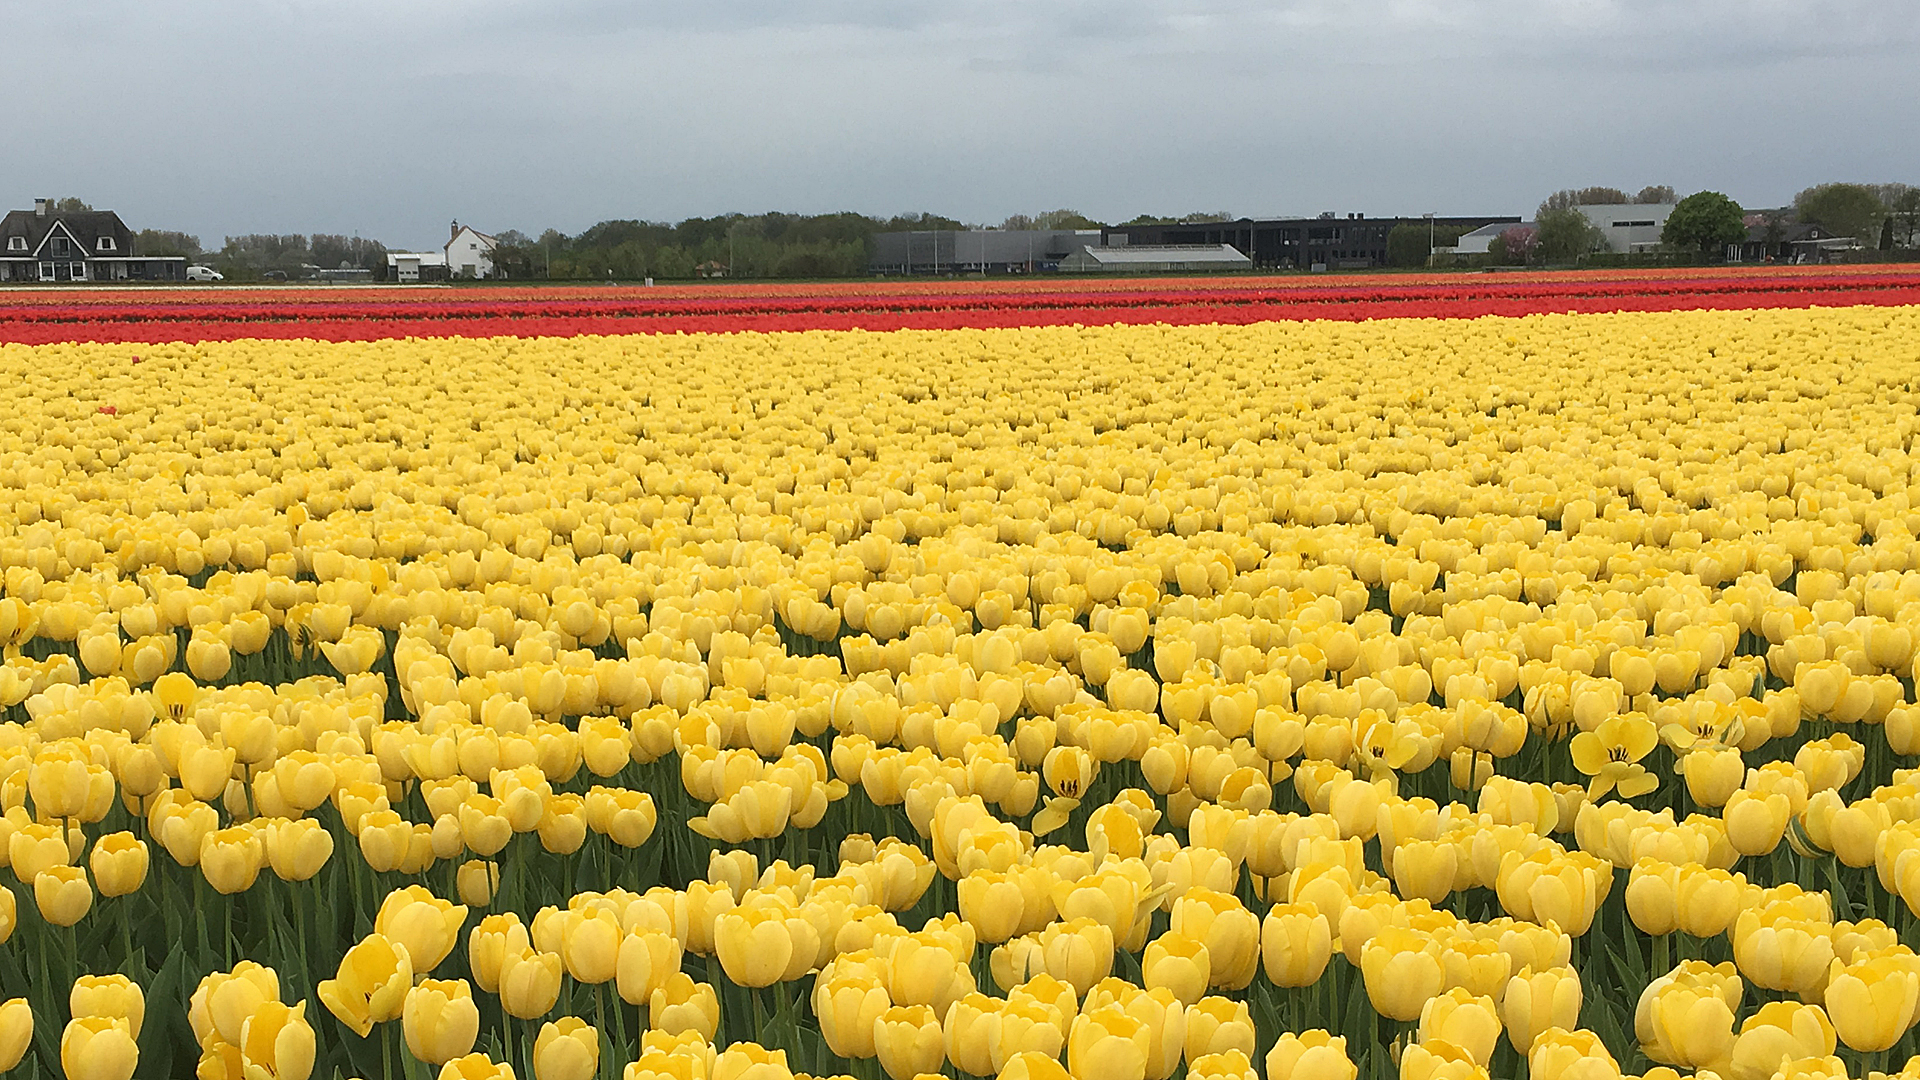
Commercial Tulip Bulb Production
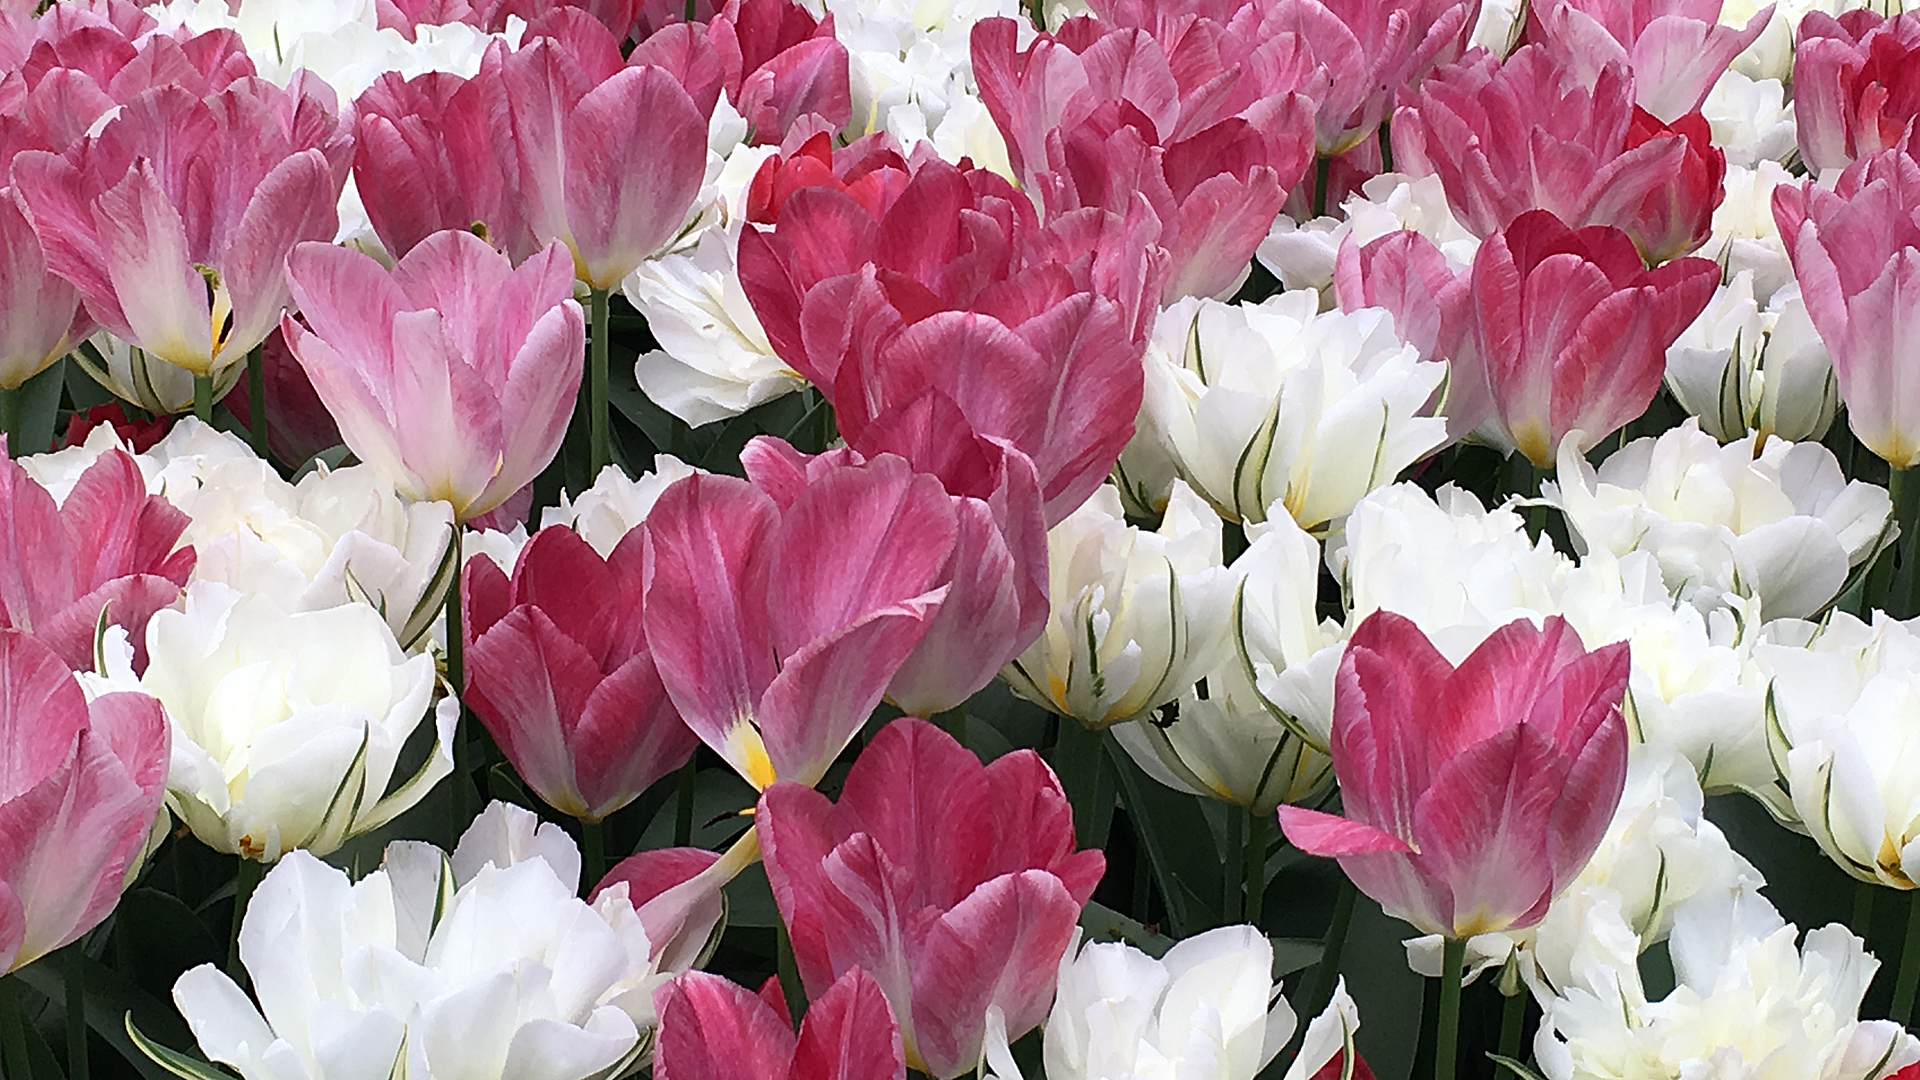
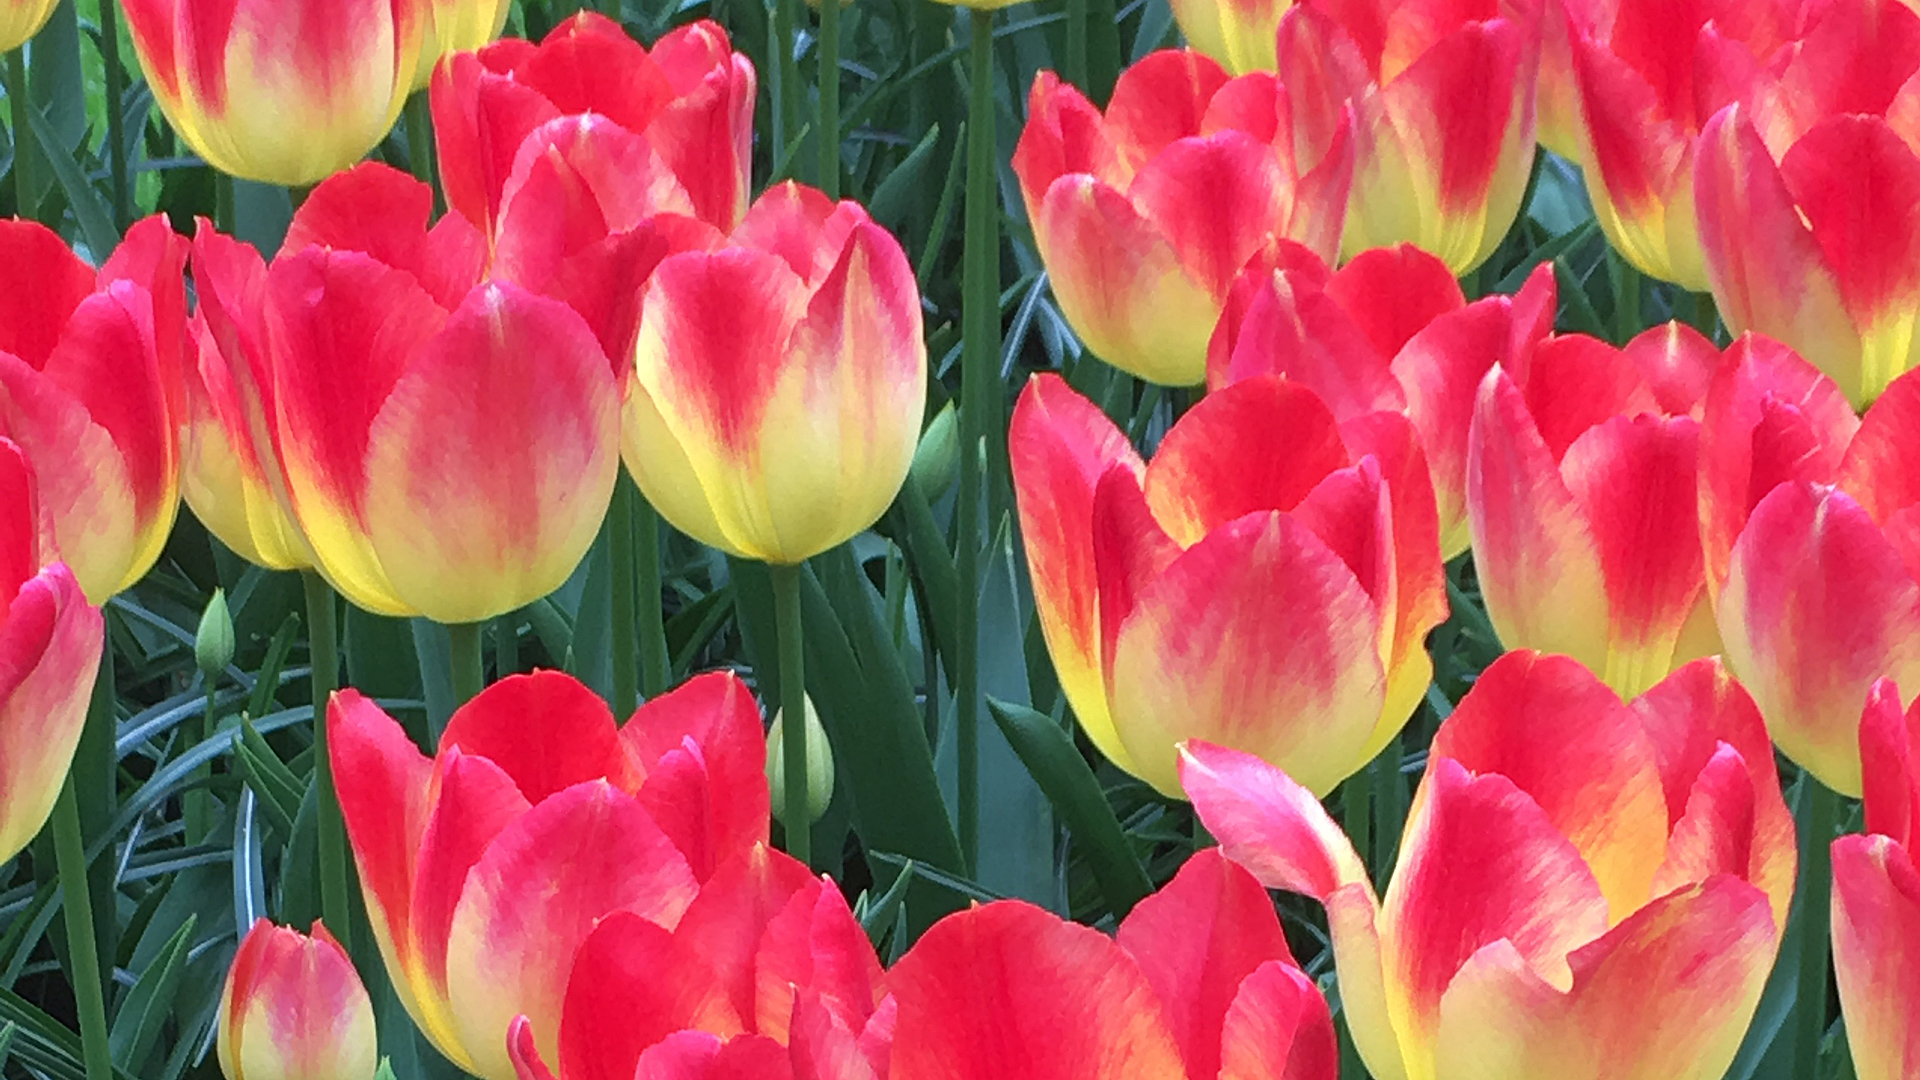
Since the Netherlands are the world's main producer of commercial tulip plants, producing as many as 3 billion bulbs annually (the majority for export) we asked to go to a farm where tulip bulbs were produced.

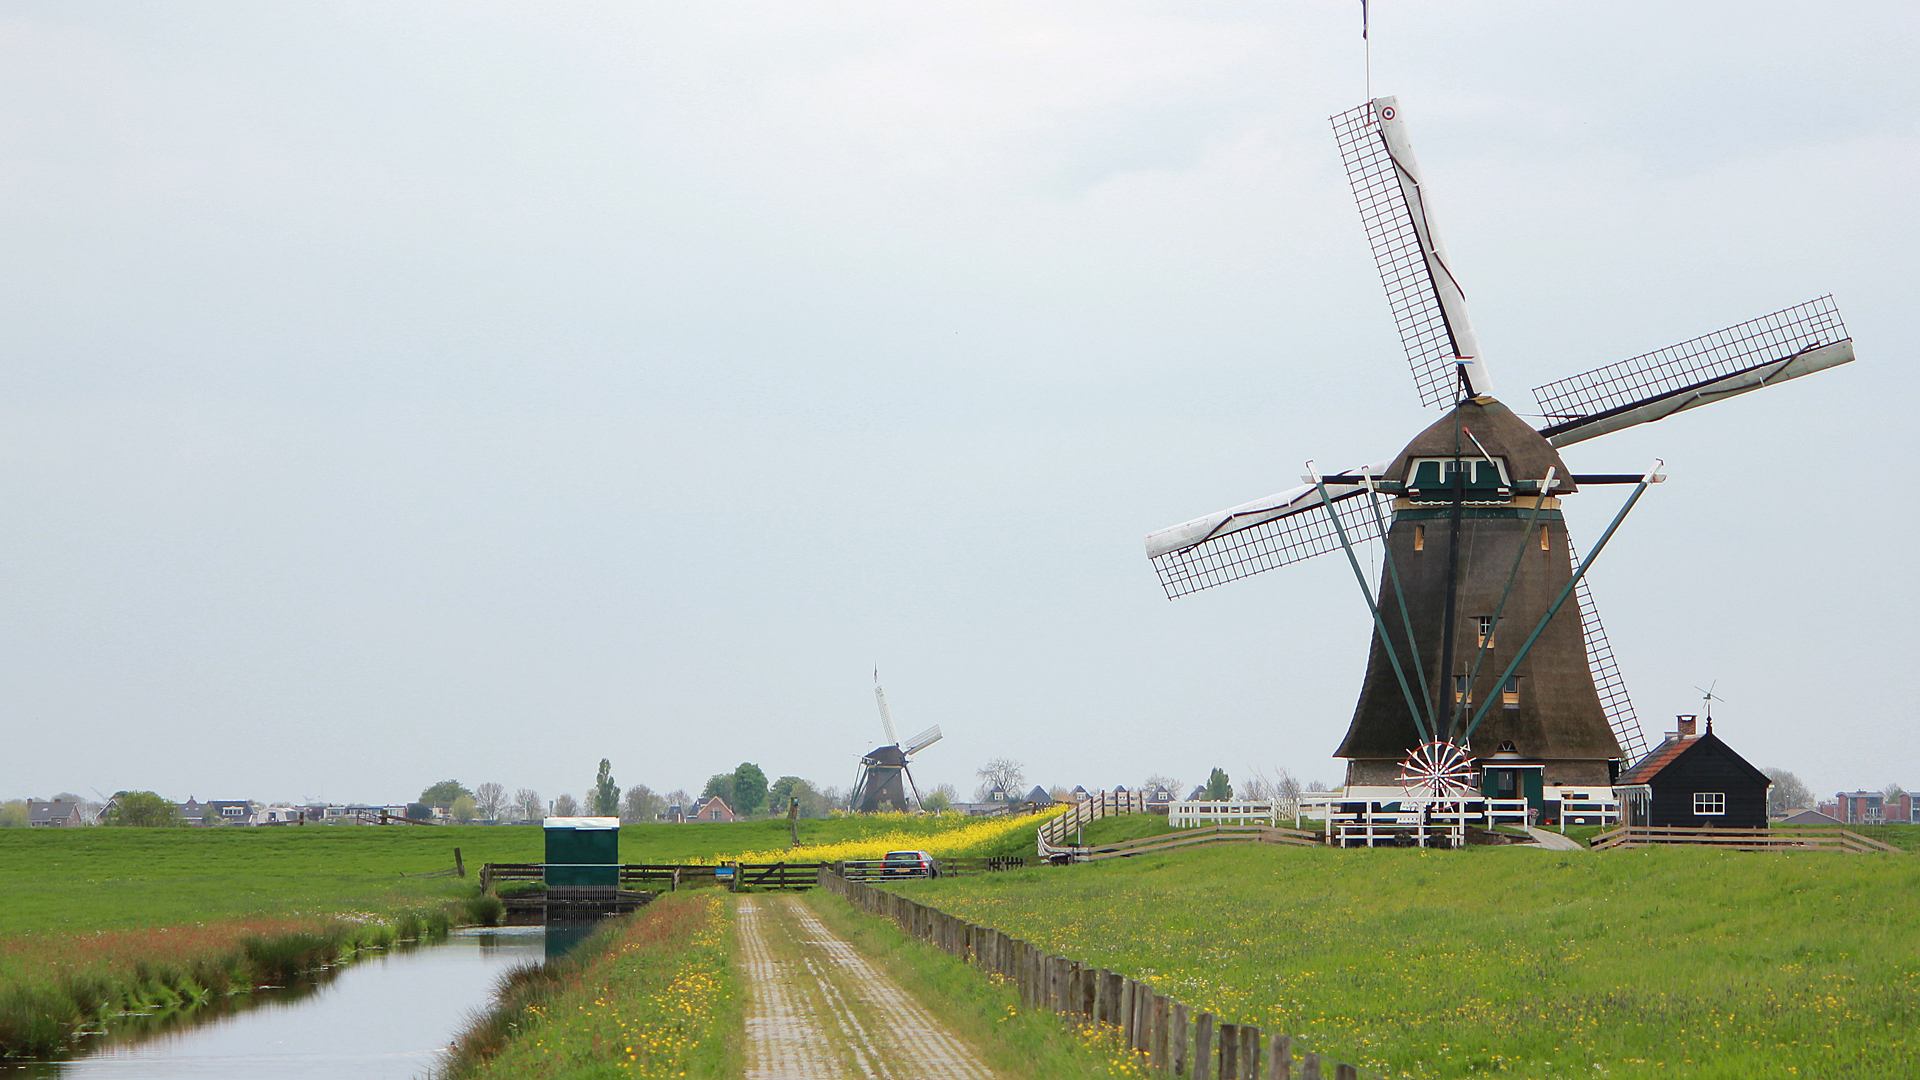
Lunch and Windmills
We then went to a local resturant for our noon meal and then went to look at some windmills. These windmills are used to pump water from the fields so they can be farmed. Then we went back to the ship. What a day.

Tulips require a cool climate and Rotterdam fits that need.
Rotterdam experiences a temperate oceanic climate (Koppen climate classification Cfb) similar to all of the coastal areas in Netherlands. Located near to the coast, its climate is slightly milder than locations further inland. Winters are cool with occasional cold days, while the summers are mild to warm. Temperatures above 860F are not rare during summer, as well as temperatures under 230F during winter. The following climate box is from the airport, which is slightly cooler than the city, as the city experiences the effect, especially the city center.
| Climate data for The Hague Airport in Rotterdam |
| Month |
Jan |
Feb |
Mar |
Apr |
May |
Jun |
Jul |
Aug |
Sep |
Oct |
Nov |
Dec |
Year |
| Record high 0F |
57.4 |
62.1 |
74.8 |
80.8 |
88.3 |
91.4 |
95.0 |
94.8 |
89.8 |
78.8 |
65.3 |
59.2 |
95.0 |
| Average high 0F |
42.8 |
43.9 |
49.8 |
56.3 |
63.5 |
67.8 |
72.0 |
71.8 |
66.0 |
58.5 |
49.8 |
43.9 |
57.2 |
| Daily mean 0F |
38.5 |
38.7 |
43.5 |
48.4 |
55.2 |
59.9 |
64.0 |
63.7 |
58.6 |
52.2 |
45.1 |
39.6 |
50.7 |
| Average low 0F |
33.4 |
32.9 |
36.7 |
39.7 |
46.0 |
51.1 |
55.6 |
55.0 |
51.1 |
45.5 |
39.6 |
34.5 |
43.5 |
| Record low 0F |
1.2 |
2.3 |
7.9 |
21.2 |
29.5 |
32.9 |
38.5 |
40.3 |
32.7 |
22.8 |
15.8 |
8.1 |
1.2 |
| Average Precipitation (inches) |
2.72 |
2.28 |
2.56 |
1.68 |
2.30 |
2.57 |
2.91 |
3.19 |
3.43 |
3.55 |
3.43 |
3.08 |
33.69 |
| Average Precipitation Days (>1 mm) |
12 |
10 |
12 |
9 |
9 |
10 |
10 |
10 |
12 |
12 |
13 |
13 |
131 |
| Average snowy days |
6 |
5 |
4 |
2 |
0 |
0 |
0 |
0 |
0 |
0 |
2 |
4 |
22 |
| Average Relative Humidity (%) |
88 |
85 |
83 |
78 |
77 |
79 |
79 |
80 |
84 |
86 |
89 |
89 |
83.1 |
| Mean Monthly Sunshine Hours |
62.5 |
83.8 |
124.0 |
174.9 |
213.9 |
203.6 |
213.1 |
196.6 |
137.6 |
106.9 |
60.4 |
46.7 |
1,623.8 |
| Source #1: Royal Netherlands Meteorological Institute (1981-2010 normals, snowy days normals for 1971-2000) |
| Source #2: Royal Netherlands Meteorological Institute (1971-2000 extremes) |