
5. Sample each representative area. The forage survey on each representative area involves four basic steps: A) tossing the plot frame, B) estimating the forage quantity in the plot, C) determining the number of samples needed, and D) correcting estimates. In each representative area, walk in a selected direction and toss the plot frame every 10 paces. Avoid biasing where the frame hits. Samples should represent actual conditions for example, bare spots as well as different quantities of forage. Using the photoguide, estimate the amount of forage in each plot and record information.
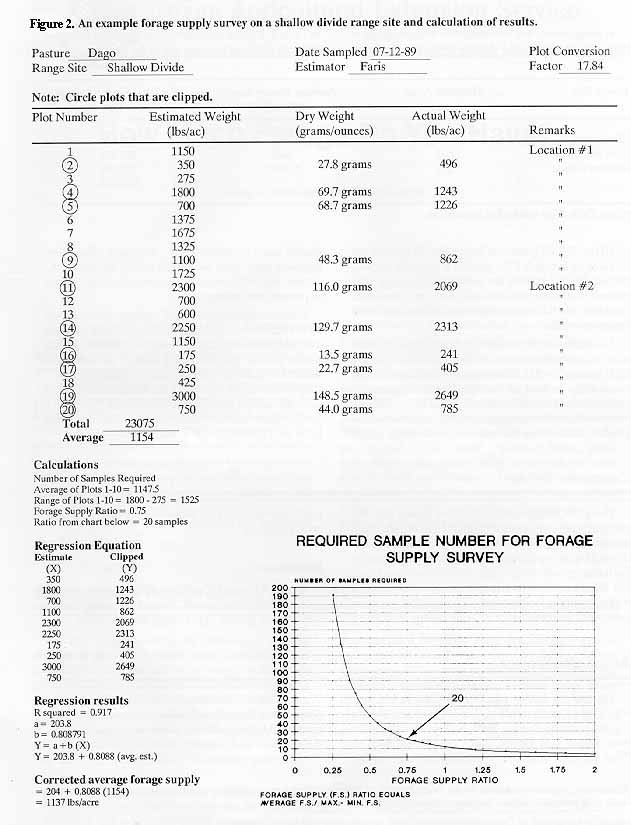
Estimate 10 plots, then determine the number of samples needed for this range site. Based on the 10 estimates, calculate the average estimate and the range of estimates (maximum minus minimum estimate). Then divide the average estimate by the range to determine the forage supply ratio. Using the chart in Figure 2, determine the total number of samples required for this representative area. This is repeated for each range site. If the number of samples required is excessive, fewer samples can be used, but the estimated forage supply will be less reliable.
While conducting the survey, a minimum of 10 estimated plots per day are clipped to establish the relationship between actual and estimated forage supply. The clipped plots should represent the range of forage quantities that are estimated each day. Oven dry the clipped vegetation and determine actual pounds per acre of forage per plot as described in the photoguide section (step 4). The survey is best conducted with two people - an estimator and a recorder. To reduce estimator bias, the recorder determines which plots to clip without telling the estimator until estimates are recorded. With this forage survey method, consistency among estimates is more important than accuracy.
6. Determine the forage supply. After completing the forage survey, calculate the average estimated pounds per acre of forage for each range site per pasture. During the forage survey, estimates were made for plots that were clipped. Summarize the data into two columns - estimate versus actual for each plot. The relationship between estimated and actual dry weight values will be used to correct the average estimated pounds per acre of forage for each range site per pasture. A statistical calculator (or computer) is required to develop a linear regression. The equation resulting from this analysis is used to obtain the corrected average forage supply. See regression example in Figure 2. The forage supply per range site per pasture is determined by multiplying the grazable acres by the corrected average pounds per acre of forage. Sum all range sites per pasture to determine the total pounds of forage per pasture. [Next Page]
Authors: Larry D. White, Calvin Richardson